Four Stock Charts Show How Gruesome the Market Got This Week
Another S&P 500 Chart Breaks Amid Worst Breadth of Bull Market
(Bloomberg) -- Stocks are bouncing back from two sessions in which the selling bordered on the historic. However long it lasts, the snapback is welcome relief considering the velocity of the downdraft through Tuesday.
“Investors are saying, ‘OK, we have gotten a correction done, we’ve traded off the headlines. Now let’s wait and see where the facts come in,’” said Chris Gaffney, president of world markets at TIAA.
Here are four charts that show how ugly it got.
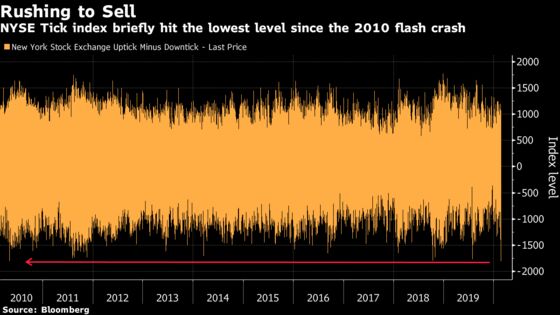
To see how fast sentiment shifted from one extreme to the other, look at this chart, plotting stocks trading at downticks versus those moving on upticks. At around 2:30 p.m. New York time Tuesday, almost 1,800 more stocks traded at lower prices on the New York Stock Exchange than higher. That was the most extreme reading since the May 2010 flash crash.
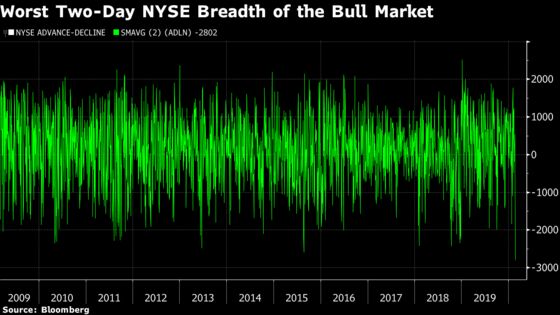
Or take this one of NYSE breadth: It shows the number of NYSE-traded stocks that retreated on Monday and Tuesday was the highest of the almost 11-year bull market.
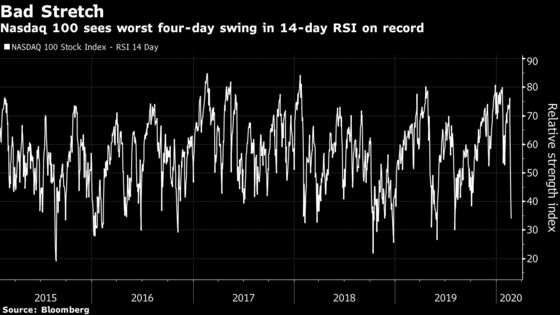
The drubbing was affirmation for skeptics who spent January and February ridiculing investors for their complacency. Now the warnings are bearing out. Take this graph of the Nasdaq 100’s 14-day relative strength index, a gauge of the magnitude and persistence of price movements. At one point, it was the worst four-day stretch on record -- worse, even, than during the bursting of the dot-com bubble. When the dust settled, the RSI move was the biggest since October 1989.
“It’s hard to tease out how much is due to extreme bullish sentiment reversing, and how much is due to the realization that a global pandemic could be unfolding,” said Chris Zaccarelli, chief investment officer at Independent Advisor Alliance. “It’s at least in large part due to the former.”
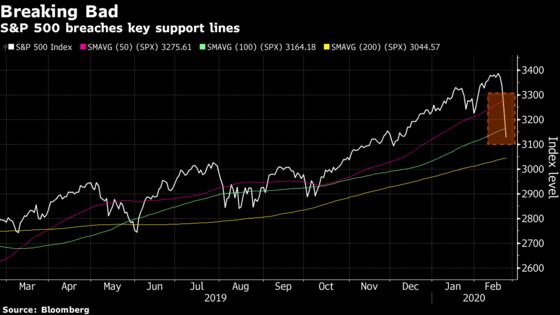
Tuesday’s fourth day of hair-trigger selling has sent the S&P 500 below its 100-day moving average line, a key level of support closely watched by chart jockeys. The index had already this week broken below its average price for the past 50 days, leaving the 200-day line as the next potential break, as far as technical analysts are concerned. Should the S&P fall an additional 2.7%, it would breach that level as well.
“Those tech lines should matter -- it tells you the psychology is changing,” said Mark McCormick, global head of FX strategy at TD Securities. “When markets are not trading on growth or fundamentals, a turn in sentiment nearly always leads to a drawdown in the things that are overbought and trading at a premium.”
To contact the reporters on this story: Vildana Hajric in New York at vhajric1@bloomberg.net;Luke Kawa in New York at lkawa@bloomberg.net
To contact the editor responsible for this story: Jeremy Herron at jherron8@bloomberg.net
©2020 Bloomberg L.P.