Seven Charts Showing Just How Crazy October Has Been for Stocks
A `Frightful Reputation’ Intact: Crazy October Stocks in Charts

(Bloomberg) -- It’s been a helter-skelter October in stocks.
Investors have been on edge, with volatility spiking and the S&P 500 Index on track for its worst month since 2010. The tech-heavy Nasdaq 100 is doing worse, falling more than 10 percent into a correction. Even the rallies are nuts. Like on Tuesday, when major averages all posted gains greater than 1.5 percent, but the S&P 500 rose and fell more than 1 percent five times.
“October has been living up to its frightful reputation for wreaking havoc on stock prices: 1929 and 1987 are prime examples, and we can now safely say that 2018 will also go down in history,” said Kristina Hooper, chief global market strategist at Invesco Ltd. “Unfortunately, I don’t foresee this volatility easing too much over the next few weeks.”
Following is a selection of charts that show just how brutal the month has been:
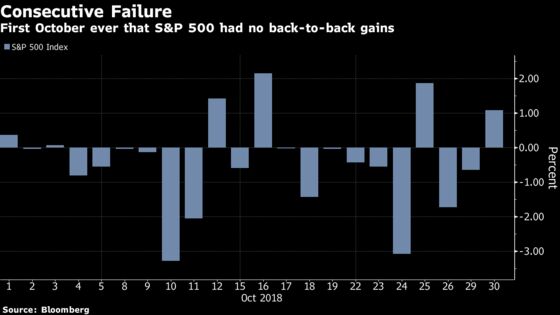
No consecutive gains
Thirty days in and there have been no back-to-back gains for the S&P 500. Going by futures on Wednesday, though, the index looks like it’ll avoid a first for October. Still, it’s closed higher on only six days this month.
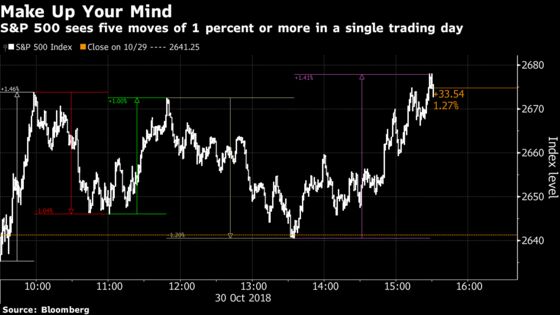
Intraday volatility
It’s a one-day snapshot, but it tells the story of a whole month. On Tuesday, the S&P 500 saw five swings of at least 1 percentage point either up or down. Even though the major averages all closed in the green, the intraday turmoil is like a printout of investor nerves -- uncertainty reigns.
“The volatility you’re seeing is in reaction to a market that has continuously had a buy-the-dip mentality that is being challenged now,” said Rick Bensignor, president and founder of the Bensignor Group. “The market is finally putting people’s beliefs to the test.”
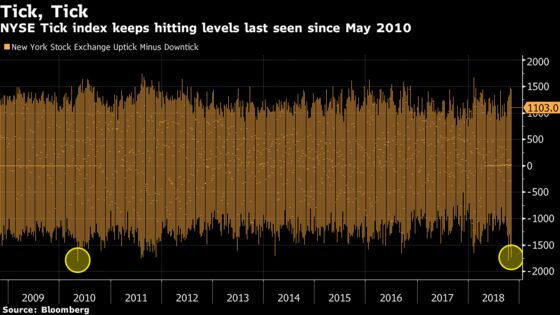
Tick index
The Tick index, which measures the number of stocks going up, trade-by-trade, versus those going down on the New York Stock Exchange, showed extreme swings on Monday as investor psychology switched from buy-the-dip to sell-it-all. The breadth gauge spiked to almost 1,500 before tumbling to about minus 1,700. Such a big intraday turnaround has happened only once before in data going back to 1989.
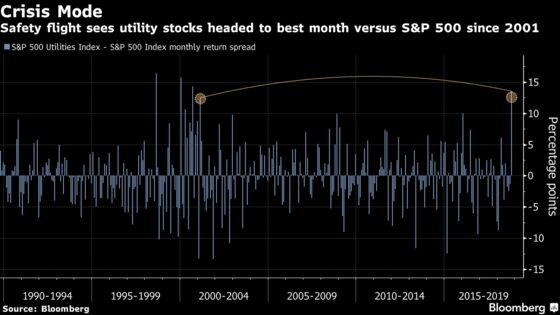
Utilities outperform
Power companies are having the best month relative to the market since 2001. In fact, utility stocks, the poster child of defensive plays, have rallied more than 3 percent in October, and are beating the S&P 500 by 12 percentage points. Such returns have occurred only four times previously -- all surrounding market crashes.
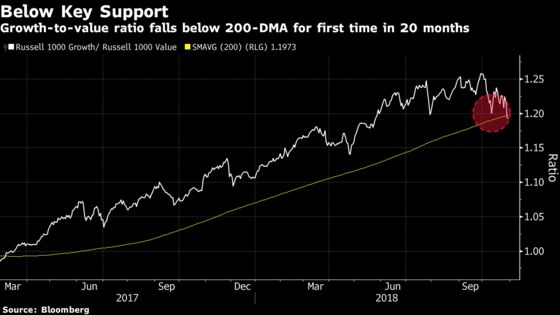
Growth play fades
Russell 1000 growth stocks have plunged below a 200-day moving average relative to value peers for the first time in 20 months. Growth-oriented areas of the market, such as the technology sector, have been pummeled in the wake of trade concerns and rising interest rates. The Russell 1000 Value Index has fallen more than 6 percent in October, compared with a near 11 percent plunge in the Russell 1000 Growth Index.
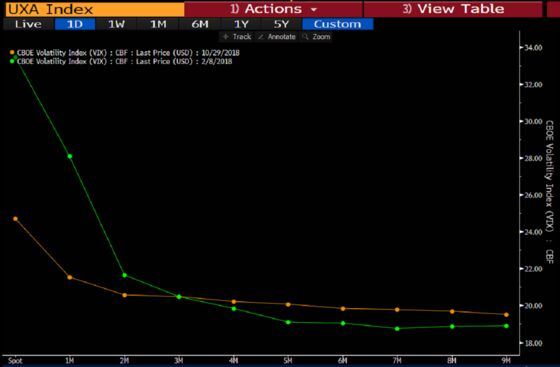
Short-term volatility
While the CBOE Volatility Index, also known as the VIX, has stayed below its February peak during the October selloff, it would be a mistake to conclude that options traders see less risk in the market. In fact, moves in futures contracts tied to the options gauge pointed to persistent volatility three months out. That’s in stark contrast with February, when the VIX curve showed a much steeper decline.
“In many ways markets are pricing in a longer-duration high volatility period than they did in the first quarter -- consistent with a view that this sell-off is driven more by reduced economic growth expectations than market technicals,” Rocky Fishman, a derivatives strategist with Goldman Sachs, wrote in a note.
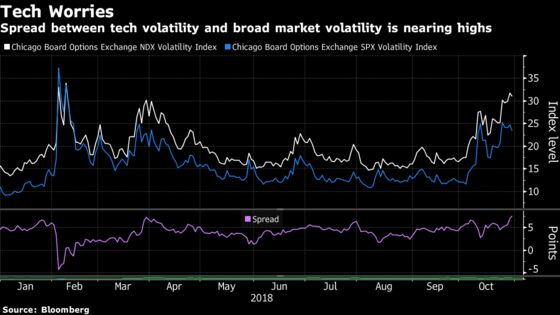
Tech volatility
Fear in the stock market has become more focused on technology stocks, if options are any guide. The spread between the Cboe NDX Volatility Index and the Cboe Volatility Index is close to the highest levels of the year. The former measures the implied volatility of the Nasdaq 100 over the next month, while the latter does the same for the S&P 500.
--With assistance from Elena Popina and Luke Kawa.
To contact the reporters on this story: Sarah Ponczek in New York at sponczek2@bloomberg.net;Vildana Hajric in New York at vhajric1@bloomberg.net;Lu Wang in New York at lwang8@bloomberg.net
To contact the editors responsible for this story: Jeremy Herron at jherron8@bloomberg.net, Chris Nagi, Richard Richtmyer
©2018 Bloomberg L.P.