Bull Market Support Breaks as Dow Ends 501-Day Technical Streak
Monday’s drop snaps the longest bullish trend since 1987.

(Bloomberg) -- The Dow Jones Industrial Average’s Monday slide just gave chartists something new to worry about.
The index’s 1.3 percent drop sent it below its 200-day average, ending a streak above the key trendline that -- at 501 days -- was the longest in three decades. The threshold, viewed by some analysts as a long-term indicator, acted as a support level twice during routs earlier this year. But it broke Monday as multinational firms including Caterpillar Inc. and Intel Corp. sold off amid concern over trade tensions.
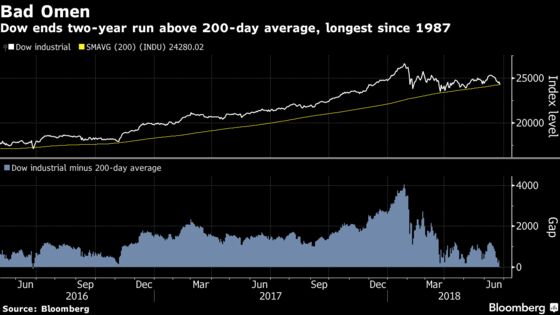
While the Dow pared losses after White House trade adviser Peter Navarro sought to ease investor concerns about U.S. policy, it failed to climb back above the long-term average, as it had on April 2 and May 3. Such a flop doesn’t bode well for stocks, if history is any guide.
In four of the five times the Dow enjoyed a longer run above its 200-day average since 1900, stocks suffered deeper losses when the streak fizzled. Those declines were 19 percent on average over the following 12 months, data compiled by Bloomberg show.
To contact the reporter on this story: Lu Wang in New York at lwang8@bloomberg.net
To contact the editors responsible for this story: Courtney Dentch at cdentch1@bloomberg.net, Chris Nagi
©2018 Bloomberg L.P.