Rare Shift in 'Fear Gauge' Shows Depth of Market Angst
Trade wars have brought fear back to the fore for U.S. equities -- and it’s showing up in volatility markets.

(Bloomberg) -- Trade wars have brought fear back to the fore for U.S. equities -- and it’s showing up in volatility markets.
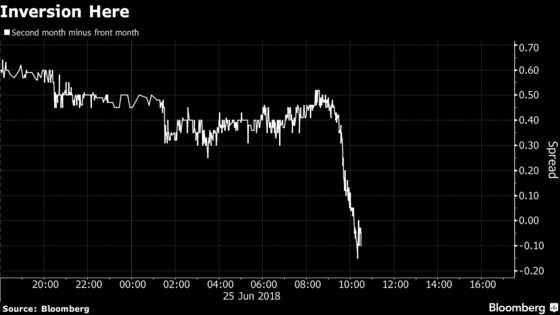
An uncommon phenomenon resurfaced amid Monday’s sell-off, which has driven the S&P 500 Index down as much as 1.3 percent this morning: The futures contract on the Cboe Volatility Index maturing in August is trading lower than the one maturing in July, in defiance of the common positive spread between front- and second-month contracts. The VIX is often referred to as Wall Street’s “fear gauge.”
Spot VIX, which measures the implied volatility of the S&P 500 Index over the next month, hit as high as 16.9 Monday, almost four points higher than its average in the past year.
Pricing front-month volatility more richly is a sign that traders are acutely concerned about the near-term risks for the S&P 500 Index. The VIX futures curve generally slopes upwards, because realized equity volatility is prone to large, episodic spikes, the timing of which is unknown ahead of time.
The last incidence of VIX curve inversion on a closing basis came in late April after Caterpillar Inc. executives said first-quarter earnings would be the company’s “high water mark” for the year. Those remarks sparked concern that the period of synchronized global growth had reached its best-before date.
To contact the reporter on this story: Luke Kawa in New York at lkawa@bloomberg.net
To contact the editors responsible for this story: Jeremy Herron at jherron8@bloomberg.net, Andrew Dunn
©2018 Bloomberg L.P.