Four Signs the Market Has Hit an Extreme
Here are four factors are often cited as indicative of tops and bottoms of markets.

(Bloomberg) -- There’s an old saying that history doesn’t repeat itself, but it often rhymes. Many market practitioners use historical analogues as part of their analytical toolkit, operating under the theory that similar patterns will tend to generate similar outcomes. One of the holy grails of market analysis is to be able to identify significant tops and bottoms with a reasonable degree of certainty. So, to that end, the first step would be to figure out exactly what characteristics are shared by past market extremes. Can we identify a set of factors that have characterized historical tops and bottoms? I decided to take a look. I’m a macro strategist who writes Bloomberg’s Macro Man column, and in these pages I’ve been examining some market maxims to see if the data support them—or not.
How exactly should we define a market top or bottom? In analyzing past behavior, I identified tops and bottoms as a prominence that represented an extreme price for the six months before and after the observation. So in looking at the Euro Stoxx 50 Index from 2014 through 2016, for example, we can see bottoms in October 2014 and February 2016, with a top in April 2015. The low established in June 2016 after the U.K. Brexit vote wasn’t a bottom because it came within six months of a lower price extreme.
While everyone has a favorite technical indicator to identify market extremes, a number of factors are often cited as indicative of tops and bottoms. Here are the four that I examined:
Price divergence. Price reaches a new extreme, but a momentum oscillator such as RSI doesn’t. (RSI—or relative strength index, one of the most commonly used technical indicators—compares the size of up moves with that of down moves during a specified period, and indexes them to a scale of 0 to 100.) I compared the 14-day RSI on the day of a price extreme with its high (for tops) or low (for bottoms) of the prior 20 trading days.
Trading volume. It’s often thought that volume picks up after market tops as investors start to rush for the exits. Conversely, conventional wisdom suggests that bottoms are formed as selling reaches a crescendo, after which markets start to rise on lower trading volume. I compared daily volume on the day of a market extreme with its average over the prior week, month, and six months. I also compared volume in the week prior to the extreme with that of the week after.
Price rejection. Everyone loves a good reversal candlestick charting pattern. A rejection of the prevailing trend—such as one that happens at a top, for example—occurs with the market making a new high but then closing lower on the day. I measured the market’s average move on days when tops and bottoms were formed.
Volatility. We usually think of tops coming during complacency and bottoms amid panic. Given that, I checked to see if realized volatility was unusually low before market tops and elevated before bottoms by comparing realized volatility of the prior two weeks with that of the prior three months.
Bloomberg’s daily high/low price data begin in 1982, and daily volume figures start in the early 1990s. Using that data, I identified market extremes across seven major equity indexes: six from developed markets—the S&P 500, Nasdaq Composite, Nikkei 225, Dax, Euro Stoxx 50, and FTSE 250—and one emerging market benchmark, the Shanghai Composite.
So is there an archetype for market extremes? Well, kind of. Markets clearly tend to exhibit certain types of behavior around tops and bottoms, but the pattern is far from ever-present. Perhaps the two clearest findings of the study are that bottoms form more often than tops and that China’s stock market is unlike any of the developed markets in the study.
First, let’s take a look at the average result for market tops across our various stock indices, which are shown below. So what does it all mean when we unpack it?
Negative divergence. On average, each market tends to show some negative divergence in momentum. The RSI on the day of the market top is lower than the peak of the prior 20 days in each of the markets surveyed.

High volume. Volume on the day of the top is on average higher than that of the prior week, month, and six months. Western markets tend to see volume tick up thereafter. Interestingly, Chinese volume tails off substantially after a top has been formed.

Price rejection. Most markets don’t exhibit tendencies of price rejection when making tops, as the indices rally on average on the day that tops are formed. Again, China is the notable exception here, where the market tends to decline after making a high.

Volatility. Vol did indeed tend to be lower than usual immediately preceding tops, though again the effect was less pronounced in China than anywhere else.

What about bottoms? Do they exhibit archetypal behavior?
Positive divergence. Every market I examined had a higher RSI on the day of the bottom than the prior 20 days. So it seems momentum divergences may be a useful indicator of market extremes.

Volume. It looks as if a volume crescendo is indicative of a bottom across most markets. China is a bit of an exception, where bottoms form amid volume that’s unremarkable by the standards of the prior six months. Intriguingly, Chinese investors appear to pile in immediately after a bottom forms, whereas volume in other markets is broadly similar the week after a bottom to that of the week before.

Price rejection. There is little evidence that bottoms form when stocks make a new low and then close higher on the day. While that is true of the S&P 500 and Shanghai markets (on average), several other indexes tend to experience deep losses on the day a bottom forms.

Volatility. It should come as relatively little surprise that realized volatility tends to be elevated around market bottoms.

This is interesting stuff, but one of the problems with using averages in a relatively small sample is that outliers can distort the results. Let’s take a look at the hit ratio of each indicator in calling tops, which is shown by clicking here. While the hit ratios are generally better than even, they suggest that these metrics are far from a failsafe indicator. They generally seem to work better in calling bottoms than tops. Moreover, you can see that on many of them the Chinese market tends to be an outlier.
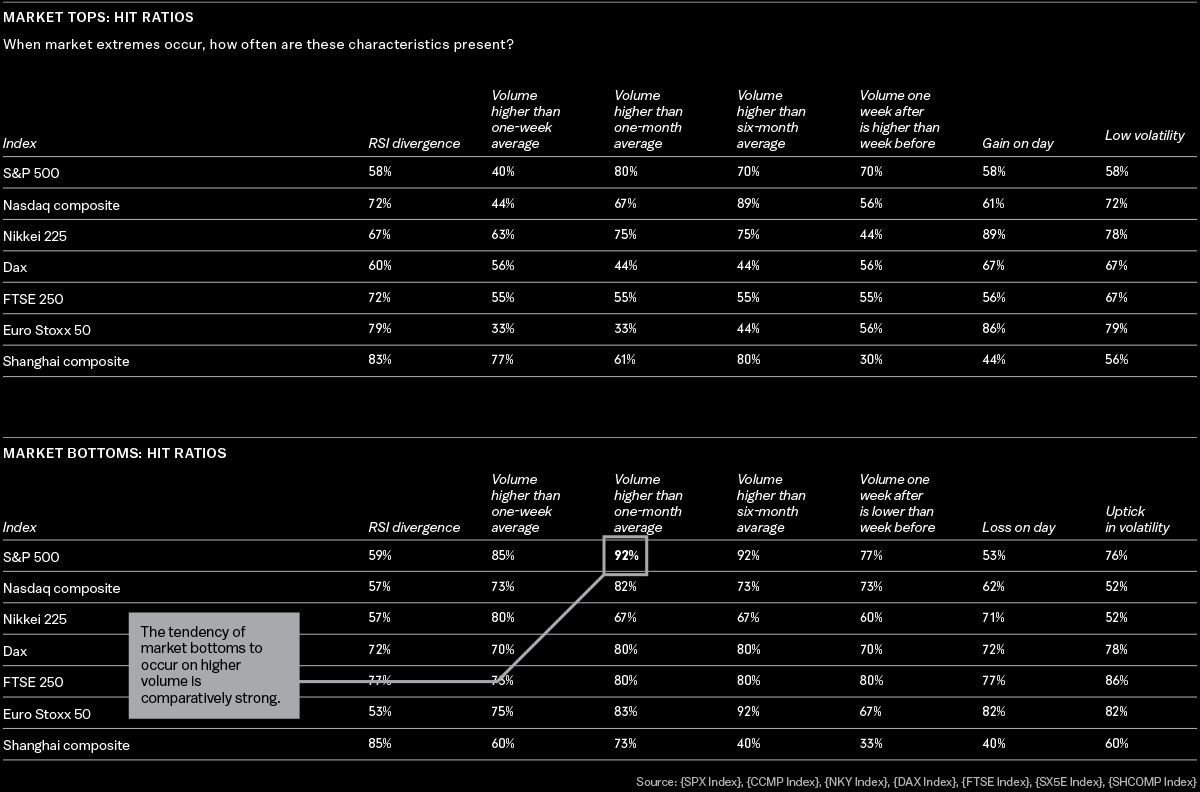
When it comes to making market extremes, history clearly doesn’t repeat. While it often rhymes, there are plenty of occasions where market behavior diverges from the norm. Unfortunately, it looks like the holy grail of calling tops and bottoms will have to remain elusive for the time being.
Crise is a macro strategist who writes the Macro Man column for Bloomberg and blogs for Markets Live.
To contact the editor responsible for this story: Jon Asmundsson at jasmundsson@bloomberg.net.
©2018 Bloomberg L.P.