Unloved Part of Treasury Curve Keeps Signaling a U.S. Recession
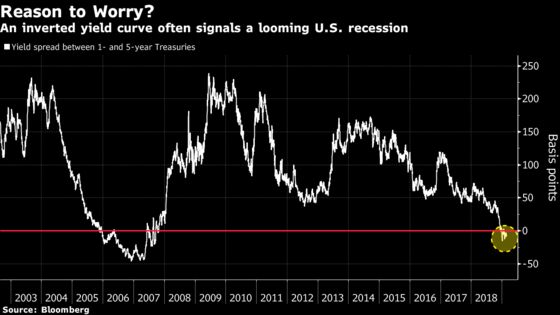
The 1-to-5-year spread is as good an indicator of economic slumps as the more commonly monitored 1-to-10-year gap.

(Bloomberg) -- Even as the Federal Reserve’s dovish pivot eases concerns over narrowing Treasury spreads and the recessionary signals they harbor, one section of the yield curve is indicating that the policy shift may be too little, too late.
The gap between 1- and 5-year yields turned negative late last year, around the time when the Federal Reserve delivered its fourth interest-rate increase of 2018 and penciled in two hikes for 2019. The gap has largely been inverted ever since, plummeting to as low as minus 18.8 basis points on Jan. 3, and trading around minus 7.3 basis points Monday.
The 1-to-5-year spread is as good an indicator of economic slumps as the more commonly monitored 1-to-10-year gap, according to Steven Blitz, chief U.S. economist at TS Lombard, a London-based research provider. The curve out to the 5-year yield may be as predictive as the spread to the 10-year because of the wide array of lending that occurs on terms of 5 years or less, including business, personal, auto, and construction loans, he said in an interview from New York.
“The whole curve doesn’t invert at once or in one fell swoop,” Blitz said. “If in the next month or two U.S. economic data deteriorate further, yields at the longer end of the curve come down and eventually deliver the more traditional inversion out to the 10-year yield.”
Demand for the belly of the curve remained robust at Monday’s $41 billion auction of 5-year notes. The highest yield at the sale was 2.489 percent, just under the prevailing market rate at the bidding deadline of 1 p.m. in Washington, while the bid-to-cover ratio of 2.40 was well above the 2.36 percent average of the prior six offerings at that tenor.
While not as closely followed as other spreads, the 1-to-5-year gap demonstrated its predictive power ahead of the last U.S. recession. In November 2005, the spread fell below zero. It bottomed at around minus 61 basis points in March 2007, in the run up to the financial crisis and ensuing economic downturn.
Other spreads may be more popular, yet the 1-to-5-year gap is “worth keeping an eye on because it does reflect an inversion in the front end of the curve,” said Brean Capital fixed-income strategist Scott Buchta.
Better Measures
Buchta regards the 3-month to 10-year, 2-to-10-year, and 5-to-30-year spreads as more reliable indicators of impending recessions, however. The 1-year sector is “no man’s land and an unloved part of the curve where there tends to be a lot of noise” that can be distorted by supply and demand imbalances, he said.
Those spreads were trading at about 21, 15 and 55 basis points Monday.
For his part, Blitz still sees a U.S. recession as avoidable.
“The Fed’s current plan, eliminating forward expectations of rate hikes and ending balance-sheet reduction, may yet flip the whole curve back to positive and thereby keep the recession at bay,” he said. “That is their hope. Ours, too. We will see whether it works.”
To contact the reporter on this story: Vivien Lou Chen in San Francisco at vchen1@bloomberg.net
To contact the editors responsible for this story: Benjamin Purvis at bpurvis@bloomberg.net, Boris Korby
©2019 Bloomberg L.P.