ETF Investors Pour Money Into China in Third Week of EM Inflows
ETF Investors Pour Money Into China in Third Week of EM Inflows
(Bloomberg) --
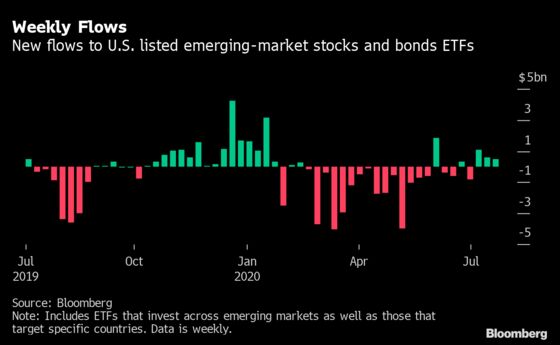
China received more than half of the money poured into emerging-market exchange-traded funds last week as investors bet on a recovery.
U.S.-listed ETFs dedicated to Chinese stocks and bonds received $276.3 million in the week ended July 24, leading emerging-market funds to record a third weekly inflow of $485.3 million, according to data compiled by Bloomberg. The move reduced total outflows this year to $16.1 billion.
The $2.6 billion KraneShares CSI China Internet Fund, known as KWEB, led the move with its largest weekly inflow since mid-January, when optimism over an initial U.S.-China trade accord stoked sentiment. The $135.7 million inflow into the internet ETF underscores a recovery in investor appetite for risk and the expectation that the pandemic and lockdown measures accelerated digital trends in the developing world.
ETFS that invest in stocks from developing nations added $334.8 million last week, beating the $150.5 million increase for bond-focused peers, the data show. Among bond-focused developing-nation ETFs, the $15.6 billion iShares JP Morgan USD Emerging Markets Bond ETF, or EMB, brought in $188.8 million, while the Invesco Emerging Markets Sovereign Debt ETF, known as PCY, suffered a $35.7 million redemption.
- Stock ETFs expanded by $334.8 million.
- Bond funds rose by $150.5 million.
- Total assets rose to $245.4 billion from $243.6 billion.
- The MSCI Emerging Markets Index closed up 0.5 percent from the previous week at 1,060.47 points.
- China/Hong Kong had the biggest inflow, of $276.3 million, led by KraneShares CSI China Internet.
- Russia had the biggest outflow, of $4.22 million, following withdrawals from VanEck Vectors Russia.
Click here for Bloomberg’s ETF screening applications.
Following are tables detailing net flows for emerging-market ETFs in US dollars. The data include the holdings-weighted allocations from multi-country funds, as well as country-specific funds(figures in USD millions unless otherwise stated):
Regional Summary
| Region | Flow Week | Equity Flow | Bond Flow | Total Assets (USD Bln) |
|---|---|---|---|---|
| Total EM | 485.3 | 334.8 | 150.5 | 245.4 |
| Americas | 89.0 | 38.6 | 50.3 | 30.7 |
| Asia Pac | 340.1 | 310.8 | 29.3 | 177.5 |
| EMEA | 56.2 | -14.6 | 70.8 | 37.2 |
Click here for Bloomberg’s ETF Excel library.
Americas
| Country | Flow Week | Equity Flow | Bond Flow | Total Assets |
|---|---|---|---|---|
| Mexico | 30.9 | 20.5 | 10.4 | 5,628.2 |
| Chile | 23.7 | 19.0 | 4.7 | 2,431.8 |
| Colombia | 6.2 | 0.0 | 6.2 | 1,425.1 |
| Uruguay | 5.1 | 0.0 | 5.1 | 523.1 |
| Panama | 5.0 | 0.0 | 5.0 | 612.4 |
| Peru | 4.9 | 0.0 | 4.9 | 1,133.9 |
| Argentina | 3.9 | 1.0 | 2.9 | 525.6 |
| Brazil | 3.9 | -1.9 | 5.9 | 17,654.1 |
| Ecuador | 2.7 | 0.0 | 2.7 | 230.5 |
| Jamaica | 1.8 | 0.0 | 1.8 | 151.9 |
| Costa Rica | 0.4 | 0.0 | 0.4 | 190.1 |
| Trinidad & Tobago | 0.3 | 0.0 | 0.3 | 28.1 |
| Bolivia | 0.3 | 0.0 | 0.3 | 25.0 |
| Venezuela | 0.1 | 0.0 | 0.1 | 5.6 |
| Belize | 0.0 | 0.0 | 0.0 | 0.4 |
| Paraguay | -0.2 | 0.0 | -0.2 | 159.7 |
Asia Pacific
| Country | Flow Week | Equity Flow | Bond Flow | Total Assets |
|---|---|---|---|---|
| China/Hong Kong | 276.3 | 273.9 | 2.4 | 92,717.4 |
| Taiwan | 16.0 | 16.0 | 0.0 | 29,899.0 |
| Indonesia | 13.8 | 4.3 | 9.5 | 4,390.4 |
| South Korea | 8.0 | 8.0 | 0.0 | 15,803.9 |
| Malaysia | 7.8 | 3.4 | 4.4 | 4,885.7 |
| Philippines | 6.6 | 0.3 | 6.3 | 2,526.1 |
| Vietnam | 6.0 | 5.7 | 0.3 | 423.7 |
| Kazakhstan | 3.8 | 0.0 | 3.8 | 512.9 |
| Sri Lanka | 1.7 | 0.0 | 1.7 | 275.3 |
| India | 1.4 | 0.4 | 0.9 | 20,259.4 |
| Thailand | 0.2 | 0.2 | 0.0 | 5,351.3 |
| Bangladesh | 0.0 | 0.0 | 0.0 | 18.8 |
| Mongolia | -0.2 | 0.0 | -0.2 | 68.7 |
| Pakistan | -1.2 | -1.3 | 0.2 | 326.5 |
Europe, Middle East & Africa
| Country | Flow Week | Equity Flow | Bond Flow | Total Assets |
|---|---|---|---|---|
| Qatar | 9.5 | 1.5 | 8.0 | 2,439.7 |
| Turkey | 6.4 | -0.5 | 6.9 | 2,318.9 |
| U.A.E. | 5.6 | 0.2 | 5.4 | 1,686.5 |
| Egypt | 4.7 | 0.1 | 4.6 | 826.1 |
| Saudi Arabia | 4.6 | -3.2 | 7.7 | 5,811.7 |
| Poland | 4.1 | 3.2 | 1.0 | 1,544.0 |
| Oman | 4.0 | 0.0 | 4.0 | 532.9 |
| Bahrain | 3.9 | 0.0 | 3.9 | 571.2 |
| Ukraine | 3.4 | 0.0 | 3.4 | 467.7 |
| Ghana | 2.4 | 0.0 | 2.4 | 204.1 |
| Kuwait | 2.1 | 0.4 | 1.7 | 719.0 |
| Nigeria | 1.9 | 0.0 | 1.9 | 393.7 |
| Hungary | 1.5 | -0.2 | 1.6 | 898.3 |
| Iraq | 1.1 | 0.0 | 1.1 | 92.4 |
| Ivory Coast | 1.1 | 0.0 | 1.1 | 93.3 |
| Romania | 0.9 | -0.1 | 1.0 | 513.2 |
| Kenya | 0.7 | 0.0 | 0.7 | 258.4 |
| Croatia | 0.7 | 0.0 | 0.7 | 144.3 |
| Senegal | 0.7 | 0.0 | 0.7 | 56.3 |
| Morocco | 0.5 | 0.0 | 0.5 | 98.7 |
| Lebanon | 0.5 | 0.0 | 0.5 | 41.7 |
| Zambia | 0.4 | 0.0 | 0.4 | 34.2 |
| Czech Republic | 0.3 | 0.3 | 0.0 | 395.1 |
| Gabon | 0.3 | 0.0 | 0.3 | 26.2 |
| Tunisia | 0.3 | 0.0 | 0.3 | 25.4 |
| Jordan | 0.2 | 0.0 | 0.2 | 194.4 |
| Serbia | 0.0 | 0.0 | 0.0 | 2.6 |
| Mozambique | 0.0 | 0.0 | 0.0 | 1.1 |
| Slovakia | 0.0 | 0.0 | 0.0 | 0.2 |
| Mauritius | 0.0 | 0.0 | 0.0 | 13.7 |
| Greece | 0.0 | 0.0 | 0.0 | 540.1 |
| South Africa | -1.2 | -5.6 | 4.4 | 8,005.8 |
| Russia | -4.2 | -10.8 | 6.6 | 8,245.9 |
©2020 Bloomberg L.P.