Trade Deal Boosts Inflows to Emerging-Market ETFs to $1 Billion
Trade Deal Boosts Inflows to Emerging-Market ETFs to $1 Billion
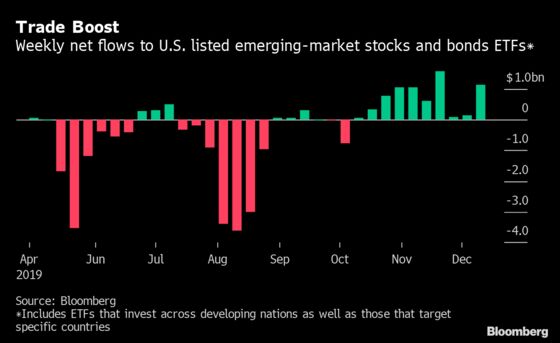
(Bloomberg) -- Inflows to emerging-market stock and bond exchange-traded funds accelerated as the U.S. and China finally agreed on a phase-one trade deal.
Some $1.15 billion was added to U.S.-listed emerging market ETFs that invest across developing nations as well as those that target specific countries in the week ended Dec. 13, more than eight times the $141.9 million inflow in the previous week, according to data compiled by Bloomberg. It was the 10th straight week of inflows, the longest streak in a year.
Flows were led by the three biggest emerging-market equities ETFs rather than country-specific funds, signaling investor optimism on the asset class. The $28.7 billion iShares MSCI Emerging Markets ETF, known as EEM, received $533 million and the $66 billion Vanguard FTSE Emerging Markets ETF, known as VWO, got $352 million, both the biggest amounts since February.
Meanwhile, the $14.9 billion iShares JP Morgan USD Emerging Markets Bond ETF, known as EMB, had a small inflow of $45 million. So far this year, inflows to stocks and bond ETFs have totaled $6.81 billion.
Emerging-market assets rallied last week on optimism the world’s two largest economies would reach a deal to avert the imposition of new U.S. tariffs on Chinese goods on Dec. 15. After some mixed messages that whipsawed markets, the two countries ultimately reached an agreement, lifting appetite for riskier assets.
- Stock ETFs expanded by $1.21 billion.
- Bond funds fell by $52.4 million.
- Total assets rose to $274 billion from $265.3 billion.
- The MSCI Emerging Markets Index closed up 3.6 percent from the previous week at 1,086.91 points, the highest level since April 23, 2019.
- China/Hong Kong had the biggest inflow, of $340.6 million, led by iShares MSCI Emerging Markets.
- Colombia had the biggest outflow, of $4.27 million, following withdrawals from the VanEck Vectors J.P. Morgan EM Local Currency Bond.
Click here for Bloomberg’s ETF screening applications.
Following are tables detailing net flows for emerging-market ETFs in US dollars. The data include the holdings-weighted allocations from multi-country funds, as well as country-specific funds (figures in USD millions unless otherwise stated):
Regional Summary
| Region | Flow Week | Equity Flow | Bond Flow | Total Assets (USD Bln) |
|---|---|---|---|---|
| Total EM | 1,153.0 | 1,205.3 | -52.4 | 274.0 |
| Americas | 145.7 | 167.4 | -21.8 | 45.0 |
| Asia Pac | 885.7 | 901.9 | -16.1 | 182.9 |
| EMEA | 121.6 | 136.0 | -14.5 | 46.1 |
Click here for Bloomberg’s ETF Excel library.
Americas
| Country | Flow Week | Equity Flow | Bond Flow | Total Assets |
|---|---|---|---|---|
| Mexico | 70.1 | 76.6 | -6.5 | 7,878.5 |
| Brazil | 59.3 | 69.1 | -9.8 | 27,902.2 |
| Chile | 17.0 | 19.1 | -2.1 | 3,063.7 |
| Argentina | 3.4 | 2.5 | 1.0 | 656.2 |
| Panama | 1.2 | 0.0 | 1.2 | 496.1 |
| Ecuador | 1.1 | 0.0 | 1.1 | 497.1 |
| Jamaica | 0.5 | 0.0 | 0.5 | 167.6 |
| Costa Rica | 0.3 | 0.0 | 0.3 | 189.5 |
| Paraguay | 0.1 | 0.0 | 0.1 | 133.6 |
| Trinidad & Tobago | 0.1 | 0.0 | 0.1 | 124.6 |
| Bolivia | 0.1 | 0.0 | 0.1 | 28.1 |
| Venezuela | 0.1 | 0.0 | 0.1 | 25.4 |
| Belize | 0.0 | 0.0 | 0.0 | 0.3 |
| Peru | -0.9 | 1.2 | -2.1 | 1,361.7 |
| Uruguay | -2.4 | 0.0 | -2.4 | 574.4 |
| Colombia | -4.3 | -1.2 | -3.1 | 1,856.4 |
Asia Pacific
| Country | Flow Week | Equity Flow | Bond Flow | Total Assets |
|---|---|---|---|---|
| China/Hong Kong | 340.6 | 339.3 | 1.2 | 83,436.2 |
| Taiwan | 266.4 | 266.4 | 0.0 | 30,606.1 |
| India | 105.5 | 104.8 | 0.7 | 26,852.7 |
| South Korea | 99.0 | 98.1 | 0.9 | 17,412.8 |
| Thailand | 28.7 | 37.2 | -8.4 | 7,562.7 |
| Malaysia | 15.2 | 19.6 | -4.3 | 5,521.8 |
| Indonesia | 14.3 | 21.4 | -7.1 | 6,077.9 |
| Philippines | 10.5 | 12.1 | -1.7 | 3,376.4 |
| Pakistan | 3.3 | 3.0 | 0.3 | 399.9 |
| Kazakhstan | 1.2 | 0.0 | 1.2 | 540.2 |
| Sri Lanka | 0.9 | 0.0 | 0.9 | 428.6 |
| Vietnam | 0.1 | 0.0 | 0.1 | 544.0 |
| Mongolia | 0.1 | 0.0 | 0.1 | 117.2 |
| Bangladesh | 0.0 | 0.0 | 0.0 | 26.4 |
Europe, Middle East & Africa
| Country | Flow Week | Equity Flow | Bond Flow | Total Assets |
|---|---|---|---|---|
| South Africa | 46.7 | 53.6 | -6.9 | 10,630.4 |
| Saudi Arabia | 26.2 | 24.5 | 1.7 | 5,561.1 |
| Qatar | 15.6 | 13.8 | 1.8 | 2,709.9 |
| Russia | 12.7 | 17.5 | -4.8 | 11,294.1 |
| U.A.E. | 9.1 | 7.5 | 1.6 | 2,027.4 |
| Poland | 3.8 | 10.6 | -6.7 | 2,068.9 |
| Kuwait | 3.3 | 2.9 | 0.4 | 853.5 |
| Egypt | 3.0 | 1.8 | 1.2 | 932.7 |
| Bahrain | 1.5 | 0.3 | 1.2 | 622.9 |
| Turkey | 1.3 | 2.4 | -1.1 | 2,821.0 |
| Oman | 1.2 | 0.0 | 1.2 | 546.2 |
| Ukraine | 1.1 | 0.0 | 1.1 | 514.2 |
| Nigeria | 0.9 | 0.2 | 0.8 | 453.9 |
| Hungary | 0.5 | 3.5 | -3.0 | 1,202.3 |
| Ghana | 0.4 | 0.0 | 0.4 | 155.1 |
| Lebanon | 0.3 | 0.0 | 0.3 | 177.2 |
| Iraq | 0.3 | 0.0 | 0.3 | 103.4 |
| Croatia | 0.3 | 0.0 | 0.3 | 200.3 |
| Ivory Coast | 0.3 | 0.0 | 0.3 | 96.1 |
| Jordan | 0.3 | 0.0 | 0.3 | 190.1 |
| Senegal | 0.2 | 0.0 | 0.2 | 61.3 |
| Zambia | 0.1 | 0.0 | 0.1 | 45.3 |
| Gabon | 0.1 | 0.0 | 0.1 | 45.2 |
| Lithuania | 0.1 | 0.0 | 0.1 | 44.2 |
| Slovakia | 0.1 | 0.0 | 0.1 | 40.8 |
| Mauritius | 0.1 | 0.0 | 0.1 | 13.2 |
| Tunisia | 0.1 | 0.0 | 0.1 | 27.9 |
| Kenya | 0.1 | -0.4 | 0.4 | 309.4 |
| Serbia | 0.0 | 0.0 | 0.0 | 3.7 |
| Mozambique | 0.0 | 0.0 | 0.0 | 0.6 |
| Slovenia | 0.0 | 0.0 | 0.0 | 44.1 |
| Morocco | -0.2 | -0.5 | 0.2 | 118.8 |
| Czech Republic | -1.8 | 1.7 | -3.5 | 519.3 |
| Romania | -2.3 | 0.6 | -2.9 | 651.2 |
| Greece | -3.9 | -3.9 | 0.0 | 1,010.7 |
To contact the reporter on this story: Aline Oyamada in Sao Paulo at aoyamada3@bloomberg.net
To contact the editors responsible for this story: Carolina Wilson at cwilson166@bloomberg.net, Justin Carrigan
©2019 Bloomberg L.P.