By This Measure, China’s Yuan Is Best-Placed Since 2012 Rally
By This Measure, China’s Yuan Is Best-Placed Since 2012 Rally
(Bloomberg) --
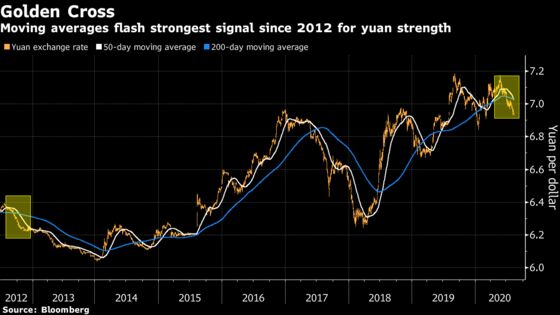
China’s yuan is flashing the strongest technical signal since 2012 for gains against the U.S. dollar.
The onshore currency’s 50-day moving average has fallen below its 200-day mean, completing the so-called golden cross pattern that some analysts interpret as a sign that a rally will continue. While such crossovers happen frequently, this is the first time in eight years that both moving averages are trending down, a phenomenon some market watchers say signals a true golden cross.
Looking for Carry Trade? Yuan Ranks Among the Best: China Today
The dollar is heading for a fifth month of losses. Meanwhile, China’s success in restarting the economy after the pandemic, the widening of its current-account surplus, its relative yields over dollar assets and foreign inflows are all supportive of further gains for the yuan.
In addition to the golden cross pattern, the currency has broken through a trend line that’s limited its gains since March 2019. The line has now become a support for the Chinese currency -- potentially limiting any losses.
Fiona Lim, a senior currency analyst at Malayan Banking Berhad in Singapore, predicts a stronger yuan and suggests investors look to the trend in the 100-day mean, now that the 50-day and 200-day averages have already completed a cross.
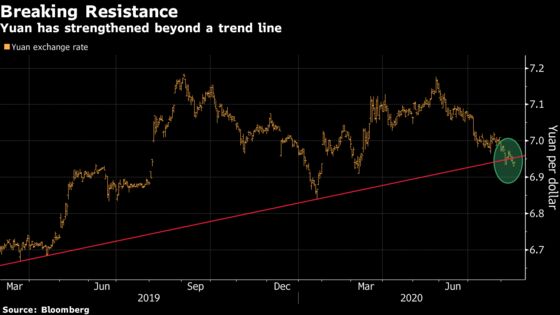
“A decisive break below could see USD/CNH trade lower towards 6.85 levels,” she wrote.
The onshore yuan was trading little changed at 6.9409 on Thursday, holding its gains since May at 3.4%. Its offshore counterpart was at 6.9372.
Look for China’s Yuan to Trade Around 7 a Dollar in 2H, UBS Says
While technicals point to further strengthening, the yuan remains vulnerable to an escalation in U.S.-China tensions. With a discussion imminent on the so-called phase one trade deal between the two nations, the next several days could be a testing time for the currency.
Speaking of EM: Chinese Yuan and Phase One Trade Risks (Podcast)
The yuan capped its last golden cross between the 50-day and 200-day averages in October 2012 when Federal Reserve stimulus stoked capital flows into China. The pattern was followed by an extended advance until January 2014, when a 5.9% rally ended.
Since then, the shorter average fell below the longer average four times -- in 2014, 2017, 2019 and earlier this year. But all of them had a rising 200-day mean, making them weaker signals.
There were also four crossovers between the 100-day and 200-day averages since 2012, but there hasn’t been one with both of them trending down.
©2020 Bloomberg L.P.