Best U.S. Job Numbers Ever? Not If You’re Out of Work for a Year
Share of unemployed people out of work for 52 weeks or longer has averaged higher than at almost any point in data from 1976-2008.

(Bloomberg) -- President Donald Trump said in his State of the Union speech last week that the labor market’s strength is evidence of an “unprecedented economic boom,” adding to his frequent boasts that include a tweet about the “best jobs numbers” in U.S. history.
Yet by one key measure, far from a boom, the labor market hasn’t even returned to a normal state. Over the past 12 months, the share of unemployed people out of work for 52 weeks or longer has averaged 13.2 percent -- higher than at almost any point in data from 1976 to 2008.

While the figure is down from a record 31.4 percent in 2011, it topped out at 12.8 percent in the 1990s and 2000s expansions during the presidencies of Bill Clinton and George W. Bush. In fact, during those years, it fell as low as 5.9 percent, meaning that within the pool of unemployed, people took less time to find a job.
The data illustrate how the labor market still has room to recover from the global financial crisis and deepest recession since the Great Depression. Taken another way, the silver lining is that the U.S. may be able to keep creating jobs for some time without spurring the kind of wage pressures that would push the Federal Reserve to raise interest rates again.
Another way of looking at the data shows how Americans out of work for a year or longer are skewing higher the average duration of unemployment. That figure stood at 20.5 weeks in January, which while down from a record 40.7 weeks in 2011, is the same as the high point in the 2000s expansion.
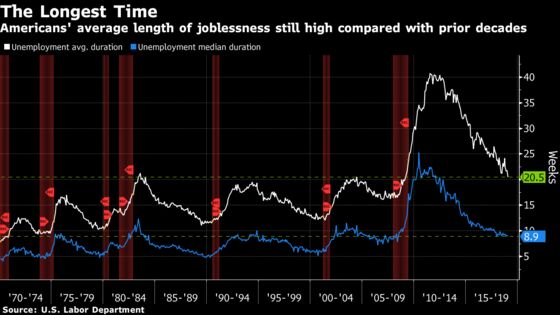
The blue line on the above chart represents the median duration of unemployment, with the latest tally of 8.9 weeks in line with levels during the 2000s expansion. That indicates that about half of unemployed Americans have spent more than two months looking for work.
The data on the long-term unemployed support the view that the economy “is not yet close to the cycle peak and that the recession probability remains low,” said Yelena Shulyatyeva, senior U.S. economist at Bloomberg Economics. “Payroll gains could remain apace with the recent trend without causing a flare up in wage inflation, although we do expect wages to continue to gradually improve.”
She pointed out that the employment-population ratio, another broad gauge of the labor market, has only recovered about half of its decline from the previous cycle’s peak and “has proven to be superior to the official unemployment rate as a predictor of wage-growth trends in the current cycle.”
To contact the reporter on this story: Scott Lanman in Washington at slanman@bloomberg.net
To contact the editors responsible for this story: Scott Lanman at slanman@bloomberg.net, Alister Bull
©2019 Bloomberg L.P.