Niti Aayog CEO Says Unequal Growth Holding India Back. Here’s What He Means
There’s an urgent need to improve India’s HDI ranking, which is lowest among the BRICS nations.

Infant mortality rates in Goa and Kerala are similar to the European and Central Asia average, while Madhya Pradesh and Odisha mirror rates found in Afghanistan and Haiti, countries with significantly lower GDP ($20.8 billion and $8.4 billion, respectively) than India ($2,597.4 billion).
Such human development disparities led Amitabh Kant, chief executive officer of Niti Aayog, the government think tank, to call for an improvement in living standards to raise India’s Human Development Index ranking, which has fallen three ranks over 10 years.
While some parts of the country are improving, there is “complete backwardness in the other parts. If this continues then India cannot grow for a long period of time”, said Kant while addressing a session on the development of Aspirational Districts by Central Public Sector Enterprises in Delhi on July 23, 2018.
“Unless we don’t improve in key areas, the pace of growth in some of these states will be very slow,” he said, according to this NDTV news report.
An IndiaSpend analysis of the most recent development indicators data shows the rate of development varies widely across states in India, building a picture of an unequal nation.
While the gross state domestic product data are equivalent to entire developed nations (e.g. Maharashtra and Finland), others are more than 84 times smaller. Similarly, states such as Gujarat have primary school dropout ratios significantly below the national average (0.83 vs 4.34), while others are more than five times higher (Assam’s is 15.46).
India currently ranks 131 out of 188 countries on the HDI, lowest amongst BRICS nations in the most recent 2016 rankings.
The HDI measures key dimensions in human development: a long and healthy life, being knowledgeable and having a decent standard of living. The index can be used to question national policy choices and assess how countries with similar gross national incomes per capita can end up with different human development outcomes.
Infant Mortality Rates Highlight Healthcare Inequality
The rate of children dying before reaching their first birthday is more than fives times higher in states such as Madhya Pradesh (54), Assam (54) and Odisha (51), compared with the best-performing states of Goa (9), Manipur (10) and Kerala (12).
As we said, this means some parts of India (Goa and Kerala) are attaining average infant mortality rate (IMR) that are the same as European nations, while the states with the highest IMR equal those of significantly less developed, often disaster/war-stricken and unstable countries.
While India has reduced IMR, deaths per 1,000 live births, by 68 percent in 41 years — from 130 in 1975 to 41 in 2015-16 — according to National Family Health Survey 2015-16 data, India’s IMR is still worse than poorer neighbours Bangladesh (31) and Nepal (29), and the African nation of Rwanda (31), IndiaSpend reported in March 2017.
IMR is seen as a useful measure of general population health, health systems and programmes. It reflects the influence of a population’s economic development, general living conditions, social well being, rates of illness, and the quality of environment on the causes of infant mortality.
The wide discrepancy in IMR between states in India indicates a high level of disparity between access to healthcare, sanitation levels and education of women — all factors shown to have an impact on the survival rates of infants, IndiaSpend reported in March 2018.
Economic Disparity
Maharashtra, India’s economic powerhouse and home to 112 million residents at the time of the 2011 census, has a GSDP of $243 billion per year, according to RBI data, equivalent to Finland ($251 billion), home to 5.5 million people.
Maharashtra’s GSDP is 5.5 times higher than Bihar, which has a population of 104 million and a GSDP of $44 billion per year, smaller than the North African country of Libya ($50.9 billion), home to 6.2 million.
While state GSDP rankings do not mirror those of infant mortality rates shown above, levels of discrepancy are equally high within this economic indicator. The top five states (Maharashtra, Uttar Pradesh, Gujarat, Karnataka and Tamil Nadu) have, on average, 84 times higher GSDP levels than the lowest five states (Manipur, Nagaland, Mizoram, Sikkim, A & N Islands), according to RBI data.
As much as 73 percent of the wealth generated in India last year went to the richest 1 percent, an increase of Rs 20.9 lakh crore from the previous year and equivalent to the total budget of central government in 2017-18, according to a 2018 Oxfam report.
Between 1980 and 2014, India had the largest gap of all countries between the growth of the top 1 percent of the population by income and growth of the full population, according to this 2017 working paper.
Education Attainment Varies Across The Country
The ratio of pupils dropping out in primary school varies widely across the country, from a peak dropout ratio of 15.46 in Assam, to a low of 0.65 in Himachal Pradesh.
The states with the highest drop out ratios (Assam (15.46), Mizoram (10.1), Manipur (9.66) and Meghalaya (9.55) ) are found overwhelmingly in the North-East of the country, an area experiencing rapid growth, alongside some of the highest levels of poverty and unemployment, although some of these states (Sikkim and Mizoram) boast some of India’s best health indicators.
India’s wealthier states tend to have the lowest levels of students dropping out, such as Karnataka (2.02), Maharashtra (1.26) and Gujarat (0.83).

Poverty is one of the main determinants of school dropout, making a state’s dropout ratio a good measure of its population’s general economic and social health, according to this 2012 paper in the International Journal of Social Sciences. The hidden and upfront costs of schooling (books, uniform, travel and fees etc.) and pressure on family members to contribute to household income often force parents to pull students out of school.
While primary enrollment ratios have improved and more children than ever before are enrolled in secondary schools, India’s education system is failing to adequately teach students what they should be learning, according to an ongoing study by the University of Oxford, IndiaSpend reported on Sept. 20, 1017.
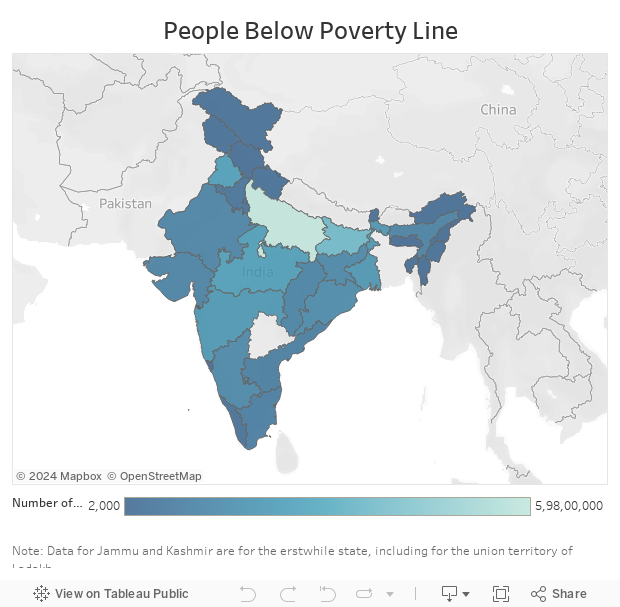
Poverty line
Uttar Pradesh and Bihar, states with low levels of annual per capita income ($643 or Rs 43,861 and $460 or Rs 31,380 in 2014-15), have the largest number of people living below the poverty line with 29 percent and 34 percent of the population earning below the required amount to meet minimum living conditions; 59.8 million and 35.8 million, respectively.
Despite having higher GSDP, Madhya Pradesh, Punjab and Maharashtra follow with a large population (23.4 million, 23.2 million and 19.7 million, respectively) living at minimum income levels.
Poverty line indicators are relative to each country and vary according to the monetary threshold of each country, decided as the minimum needed to achieve basic living standards.
India had the largest number of people living under the international $1.90 a day poverty line in 2016, according to this World Bank report. This figure is more than 2.5 times as many as Nigeria, which has the second-largest population (86 million) of the poor worldwide.
(Sanghera, a graduate of King’s College, London, is an intern with IndiaSpend.)
This article has been published in arrangement with IndiaSpend.
BloombergQuint