Investors Are Doing Fine as Their Own Money Managers
(Bloomberg Opinion) -- Now that the bear market is officially over, with the U.S. stock market having reclaimed its pre-coronavirus peak in August, it’s a good time to ask how well investors navigated the market’s breakneck plunge and recovery, the fastest round-trip on record. The answer may inform another question that is increasingly on the minds of individual investors: whether to hand their savings to a money manager or invest it themselves.
Investors have never had more places to put their savings. Money management was once reserved for the well-heeled, but now everyone from Wall Street banks to discount brokers to fund companies to independent robo-advisers will happily look after anyone’s money, no matter how modest the sum. Alternatively, do-it-yourself-minded investors can purchase low-cost exchange-traded funds that track broad stock and bond markets on Robinhood and other free trading apps, which is cheaper than paying a money manager.
Or is it? Money managers like to say that investors are better off hiring a professional, even after accounting for fees, because the manager will stop them from making costly mistakes. Chief among them is investors’ reputation for ill-timed investment moves, loading up on stocks during booms and dumping them during busts.
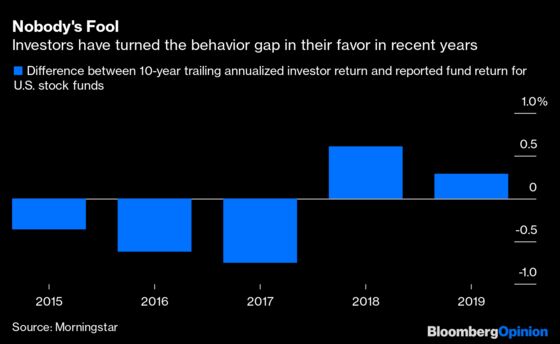
But recent data suggest investors no longer deserve that reputation, at least when it comes to investing in U.S. stocks. Morningstar’s annual “Mind the Gap” report estimates the impact of investors’ behavior on their investments in U.S. mutual funds and ETFs. Specifically, it attempts to measure the so-called behavior gap, or the difference between the performance reported by funds and the returns investors in those funds manage to capture. According to the latest report, the gap for U.S. stock funds was a positive 0.29% a year during the 10-year period from 2010 to 2019, meaning that on average, investors captured every bit of their funds’ return and then some.
It wasn’t always so. During the 10-year period ending in 2015, the first 10-year period in Morningstar’s report, the gap was a negative 0.36%. The next two 10-year periods ending in 2016 and 2017 were even more negative. But beginning during the 10-year period ending 2018, the gap turned positive. One reason for the improvement is that 2008 dropped out, a year in which investors dumped U.S. stocks in huge numbers as the market collapsed in response to the financial crisis.
Investors appear to have learned from that experience, as the positive behavior gap during the last 10 years suggests. But the last decade was also notable for an unusually long and uninterrupted bull market, and investing is obviously a lot easier when stocks are surging. The recent, albeit brief, bear market was the first opportunity since the financial crisis to gauge how investors would hold up during a market plunge.
So how did they do? Shockingly well. Early indications suggest that most of them didn’t budge. Monthly net flows as a percentage of total assets in U.S. stock mutual funds and ETFs have been consistently minuscule this year, averaging 0.26% per month through August with little variation, according to numbers compiled by Morningstar. In other words, faced with one of the wildest market gyrations on record, most investors just shrugged their shoulders.
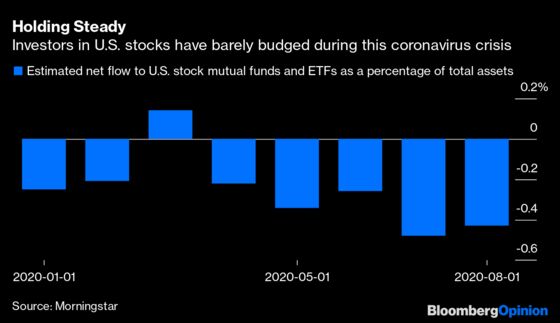
If anything, those who moved money around this year more likely bought low and sold high rather than the other way around. U.S. stock funds took in a net $10 billion during the market’s swoon in March. Since then, as the market has recovered, investors have pulled on average a net $31 billion a month from those funds.
That squares with Dalbar’s widely followed “Quantitative Analysis of Investor Behavior,” which attempts to track investors’ moves into and out of mutual funds. The latest report finds that “the average investor’s appetite for equities has remained unchanged throughout the Covid crisis.” It also jibes with a recent report from Vanguard Group, which oversees more than $6 trillion in assets, finding that its investors mostly stayed put as Covid-19 rattled markets. Only 5% of self-directed investors in Vanguard’s retirement plans and 17% of its retail households traded between Feb. 19, the market’s pre-coronavirus peak, and May 31. And less than 0.5% of investors panicked and moved to all cash.
All of that should give DIY-minded investors a shot of confidence . And investing their own money needn’t be complicated. A well-diversified portfolio can be had with just two low-cost ETFs: a global stock fund, such as the Vanguard Total World Stock ETF, and a U.S. bond fund, such as the Vanguard Total Bond Market ETF or the iShares Core U.S. Aggregate Bond ETF. Those afraid to venture outside the U.S. – which I think is a mistake – can substitute a U.S. stock fund, such as the Vanguard Total Stock Market ETF or the iShares Core S&P Total U.S. Stock Market ETF, for the global stock fund.
In any combination, that two-fund portfolio will cost investors somewhere between 0.03% and 0.08% of their money a year, which is about as close to zero as it gets. And the ETFs can be bought commission free on most trading apps. (Full disclosure: I own Vanguard and iShares funds and my asset-management firm buys them for clients.)
Striking a balance between stocks and bonds needn’t be complicated, either. One simple way to do it is to decide how much risk you want to take on a scale from one to 10, one being low risk. Then, multiply that number by 10 and that’s your allocation to stocks. For example, if your number is six, you would allocate 60% to stocks and 40% to bonds.
The risk score is also a handy tool for estimating how much the portfolio is likely to decline during a downturn, which is a useful hack for making sure the score you pick isn’t riskier than you can handle. Just multiply the risk score by four and that’s roughly the decline you’re likely to experience. Continuing the previous example, a risk score of six would imply a decline of about 24% during the occasional bear market.
That’s roughly the average peak-to-trough decline during the three bear markets since 1988, the first year for which performance data is available for global stocks. If history is a guide, any declines are likely to be temporary, as broad markets have always recovered. Even so, if the decline implied by your risk score starts your heart racing, it’s probably best to dial it down – particularly because the lower the risk score, the more the estimate is likely to overstate the potential decline.
None of this is to say there aren’t good reasons to hire a money manager. Perhaps you have no interest in managing your own money. Perhaps you need someone to talk you out of selling when markets wobble. Maybe you want personalized advice about how much of your paycheck to save or how much to spend in retirement. Or maybe you just like a manager’s investment style.
This column does not necessarily reflect the opinion of the editorial board or Bloomberg LP and its owners.
Nir Kaissar is a Bloomberg Opinion columnist covering the markets. He is the founder of Unison Advisors, an asset management firm. He has worked as a lawyer at Sullivan & Cromwell and a consultant at Ernst & Young.
©2020 Bloomberg L.P.