The Most Important Number of the Week Is $25.6 Trillion
(Bloomberg Opinion) -- To say the pandemic has turned traditional economic theory on its head would be an understatement for the ages. No economist can say with a straight face that he or she predicted that the sharpest contraction since the Great Depression would just as quickly turn into boom times not seen since the 1980s. Likewise, no market strategist can say he or she predicted the historic rally in stocks or appreciation in home prices that accompanied the pandemic.
This week brought some more news that no one thought would be possible during a pandemic, which is that U.S. household net worth ballooned by $25.6 trillion in the 12 months ended March 31, bringing the total to $136.9 trillion. To put the rise in perspective, consider that the average annual increase in the 10 years through 2019 was a measly $5.35 trillion.
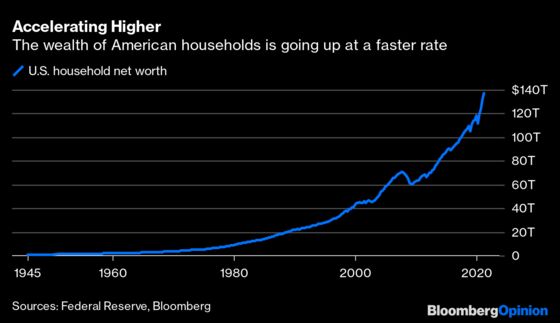
There are a few of ways to think about this development. The first is that it’s a testament to the swift actions by the government and Federal Reserve to support the economy by injecting trillions of dollars into the pockets of consumers and into the financial system.
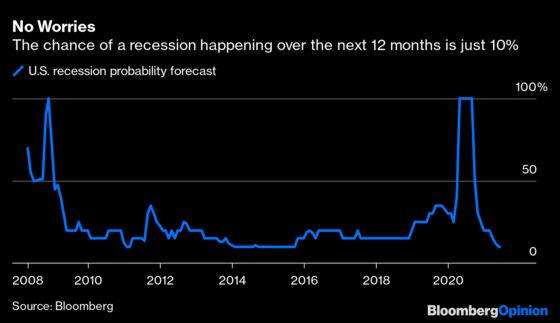
Those moves should help underpin the economy for years to come. The latest monthly survey of economists by Bloomberg News was released Friday, and it showed that the chance of a recession over the next 12 months is 10%, matching the lows for the series started in 2008.
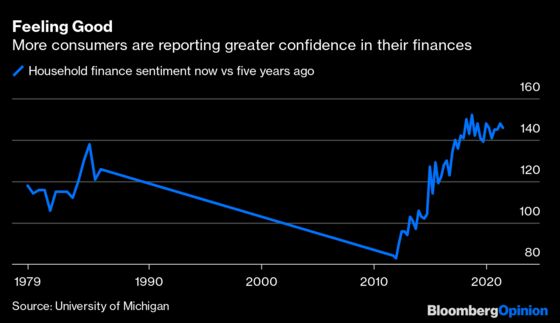
It’s not all good news, though. For one, it’s possible that all this wealth creation could lead households to become more tolerant of higher consumer prices on a sustained basis. After all, what’s a few extra hundred dollars on the cost of a backyard grill when your net worth has gone up by many multiples of that? If that way of thinking comes to pass, it would upend the idea that the current spike in inflation rates is just transitory and largely due to supply chain disruptions, as the Fed suggests.
Recall how inflation rates jumped in 2005 after household net worth grew by some 25% during 2003 and 2004. Or how the same thing happened in 2000 after net worth swelled by more than the amount in the previous three years. And let’s not forget how inflation rates went from 1.1% in 1986 to 6.3% in 1990 after the big buildup in wealth in the late 1980s.
There’s a very important wrinkle to all this, which is that income inequality has become greater over time, resulting in what has become known as the “K-shaped” recovery. There’s strong evidence that the increase in household net worth has been concentrated at the upper end. Of the $5 trillion increase in the first quarter, Fed data show that some $3.2 trillion came from gains in the stock market, and $968 billion came from real estate holdings.
So, if you don’t have exposure to the stock market or aren’t a homeowner, you missed out. That’s no small part of the population. In 2020, about 55% of Americans owned some form of stock, down 5 percentage points from 2000, according to the Visual Capitalist website. Also, stock ownership seems to be strongly linked to household income, the website notes. Last year, 84% of U.S. households earning $100,000 or more owned stock, compared with just 22% of those making less than $40,000.
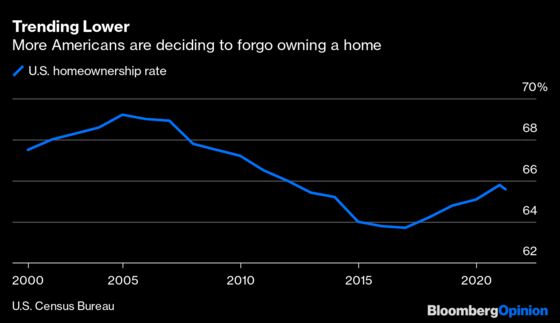
The rate of homeownership is also down, dropping to 65.6% as of the end of the first quarter from a peak of 69.2% in 2004, according to the U.S. Census Bureau. For reasons that aren’t entirely clear, the rate for those in their prime buying years, or 35 to 44, is down even more, to 62% from 70.1% in 2005.
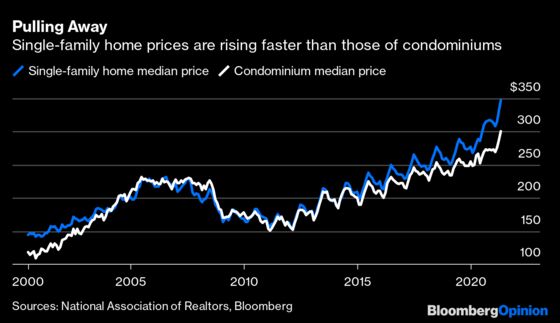
So, just like the K-shaped recovery, could inflation become K-shaped as well, with upward pressure on prices felt most for goods and services favored by higher-income households? Once again, look to the housing market for possible evidence that this may be happening already. The price of condominiums, generally targeted to lower-income households, has risen 13.8% since March 2020, trailing the 23% gain in more expensive single-family homes, according to the National Association of Realtors. Never before have condominiums trailed by so much.
And if future inflation becomes K-shaped, it’s more likely that the Fed will keep monetary policy looser for longer than many anticipate to support lower-income households and address inequities in the economy. When asked last year whether the Fed’s policies have contributed to wealth inequality, Chair Jerome Powell had this response, according to Axios:
If the Fed pulled back its support for the economy because it was worried about its impact on equity prices, "What would happen to the people that we’re actually, legally supposed to be serving?" Powell huffed.
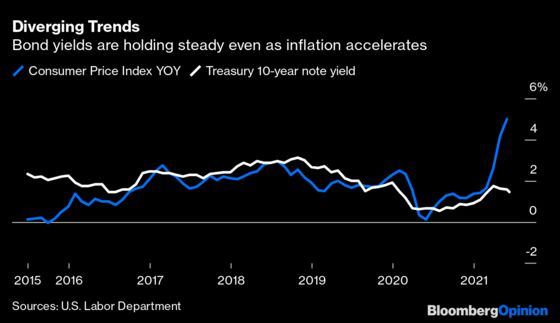
Recent moves in the bond market may be reflecting that sentiment. Yields on benchmark 10-year U.S. Treasury notes fell this week to their lowest since early March even though the government said its consumer price index rose 5% in May from a year earlier. If bond traders thought that faster inflation would induce the Fed to tighten monetary policy, then yields would have risen, and not just by a little.
The economy’s reaction to the pandemic and the unprecedented measures taken by the government and Fed have been impossible to predict, and there’s no reason to expect that will change soon. If anything, expect the unexpected.
This column does not necessarily reflect the opinion of the editorial board or Bloomberg LP and its owners.
Robert Burgess is the Executive Editor for Bloomberg Opinion. He is the former global Executive Editor in charge of financial markets for Bloomberg News. As managing editor, he led the company’s news coverage of credit markets during the global financial crisis.
©2021 Bloomberg L.P.