(Bloomberg Opinion) -- The terrorist attacks of Sept. 11, 2001, and the American reaction to them, keep reverberating. This summer’s messy U.S. withdrawal from Afghanistan is one obvious after-shock, and it’s clear the impacts go far beyond that.
Much of what seems broken in the U.S. today, journalist Spencer Ackerman writes in his new book “Reign of Terror: How the 9/11 Era Destabilized America and Produced Trump,” can be traced to the actions and reactions of the early 2000s. All over the world, Norwegian defense scholar Thomas Hegghammer contends in the latest issue of Foreign Affairs, the surveillance capabilities developed in the wake of the attacks have shifted the balance of power toward governments and away from individuals. The “War on Terror” also accelerated the rise of right-wing violence in the U.S. and elsewhere, American extremism researcher Cynthia-Miller Idriss argues in the same magazine. And so on.
Finding statistical evidence of the lasting effects of 9/11 is harder. After a colleague asked a few weeks ago about the economic shifts set in motion by the attacks, I started downloading data series and making charts, as is my habit. What I found in most of the economic series was not so much absence of impact as a fleeting one, and also a much smaller mark from 9/11 than from the Covid-19 pandemic. When I looked at things that could be said to directly measure the reaction to the attacks, such as military spending and security-services employment, the effects of 9/11 were more durable, but still seem to have faded in recent years.
To some extent this speaks to the limits of statistics, or at least of the statistics I’ve chosen. Those attributing transformative effects to 9/11 aren’t necessarily wrong. But at a major event anniversary like this that will generate all sorts of grand claims, charts can provide some helpful context. Here are 10.
Things That Went Up
Given that the U.S. invaded first Afghanistan and then Iraq in response to the 9/11 attacks, military spending is an obvious metric to look at. After the 2001 fiscal year, which ended Sept. 30, 2001, it rose markedly as a share of gross domestic product — the standard way to track government spending over time.
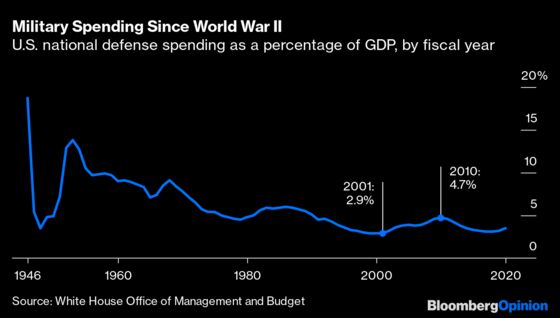
Over the second half of the 20th century, military spending’s share of GDP mostly fell. So far in the 21st it hasn’t, which seems like a big deal. The long decline seems to have stalled a couple of years before 9/11, though, and even at its 21st-century peak in fiscal year 2010 (which owed a lot to the 3.1% decline in real GDP over the previous fiscal year, reducing the denominator in the spending/GDP calculation) spending was still lower than in all but two of the years from 1941 to 1990 (I’ve left off the World War II years because the more-than-35%-of-GDP spending then would render the rest of the chart effectively unreadable).
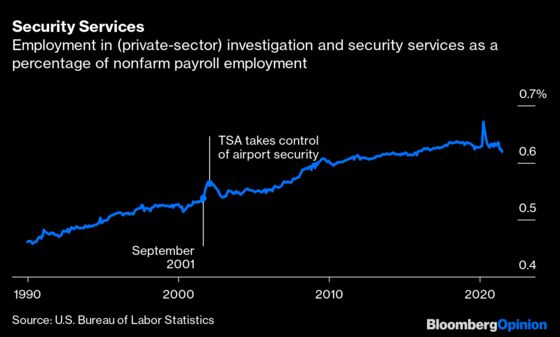
A lot of the security response to 9/11 wasn’t strictly military, as new screening procedures and surveillance techniques proliferated domestically. Employment in private investigation and security services in the U.S. rose sharply in the months after the attacks, although the creation of the Transportation Security Administration and subsequent federalization of airport security in early 2002 took a lot of those jobs out of the private sector.
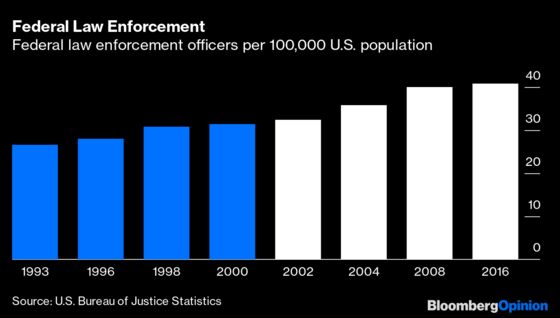
Such timely, monthly data isn’t available on law-enforcement personnel, which the Bureau of Labor Statistics folds into broader government employment categories. The Bureau of Justice Statistics does conduct occasional surveys of law-enforcement employment, which show a big increase at the federal level in the 2000s.
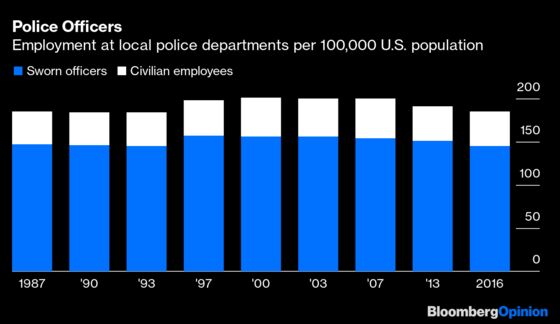
There was no such evidence of a 9/11 effect on police departments, in part because they’d already done so much hiring in the second half of the 1990s thanks to funding included in the now-much-criticized 1994 federal crime law. Police employment then fell from 2007 to 2016 (in absolute terms as well as the per-capita measures shown here) as state and local tax revenue slumped during and after the Great Recession.
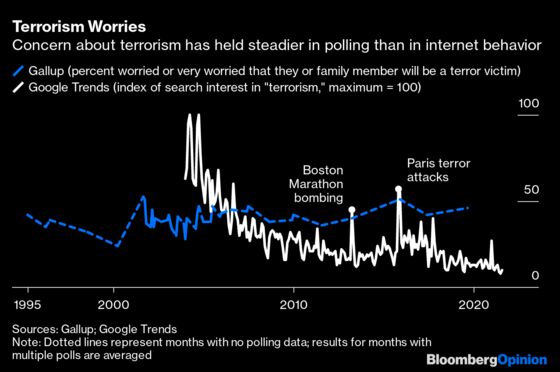
Public concern about terrorism understandably rose after the attacks. It has remained stubbornly high in the two decades since if you go by Gallup polls, which have consistently found that between about 40% and 50% of Americans are very or somewhat worried that they or members of their family will be victims of terrorism. The web search activity tracked since 2004 by Google, on the other hand, shows a big decline in “terrorism” searches since then, albeit interrupted by occasional spikes around news-making terrorist attacks.
All in all, then, the decade following the 9/11 attacks saw the kinds of increases in military spending, security-sector employment and public concern about terrorism that you might expect. But by the 2010s most of these had plateaued or were declining.
Things That Went Down
In the immediate aftermath of 9/11, the attacks seemed to have changed America in lots of other ways beyond the rise of the security state. It was feared that the economic damage would be severe and lasting. It wasn’t. For aggregate measures such as GDP, employment and the Standard & Poor’s 500 Index, it seems to have been so fleeting that I’m not even going to bother with charts. The U.S. economy had already been in a recession since March 2001 as the technology-stock bubble deflated, and the attacks briefly accelerated the downturn, but by the end of the year GDP was growing again. The S&P retraced its post-attack losses in less than a month. Stocks started falling again after that and employment declines continued into 2003, but other factors such as the tech bear market and the “China shock” in manufacturing surely played a bigger role than 9/11.
For specific places and industries, the effects were more severe. New York City was the main target of the attacks and the airline industry its clearest economic victim. The previous quarter century’s trend toward globalization of the U.S. economy was in fact under threat. But things turned around pretty quickly on all of these fronts too.
In the immediate aftermath of 9/11 New York City reeled, losing 112,000 payroll jobs in just two months. In retrospect those two months now look like a brief acceleration of an already established recessionary downtrend (so brief that I couldn’t annotate it in the chart because that obscured the drop), which in 2003 gave way to a long recovery that paused only briefly for the Great Recession.
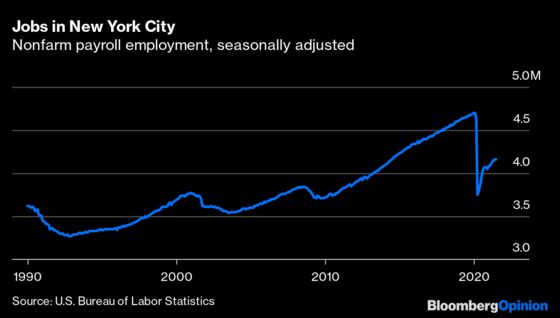
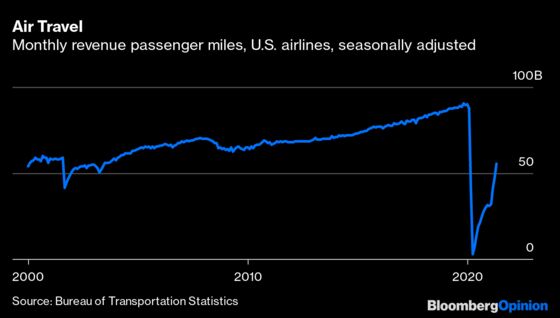
The city’s job losses since the beginning of the the Covid-19 pandemic are of another scale entirely, raising legitimate questions about its economic future. The same is true for air travel, for which the apocalyptic-seeming months following 9/11 now look like a blip in comparison with what’s happened since March 2020.
The number of international visitors to the U.S. shows a similar trajectory, albeit with much less of a recovery so far this year.
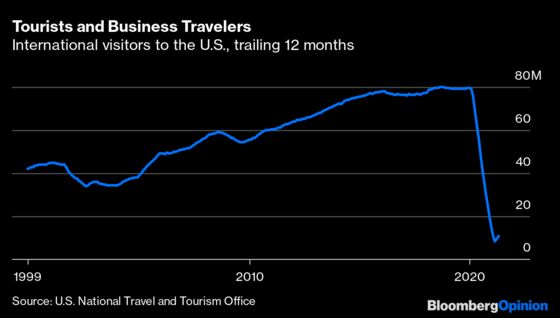
The disruptions to the movement of people caused by 9/11 seemed really major at the time, and it took more than two years for airline traffic and nearly four for international visitor numbers to recover. But the pandemic has thrown up far more formidable barriers.
Trade in goods and services, on the other hand, was no more affected last year than in 2000 and 2001 — at least not if you go by its share of GDP. In both cases, the traumatic events merely accelerated trade declines that were already in motion, yet both declines ended up being much less severe than the drop that followed the global financial crisis in 2008 and 2009.
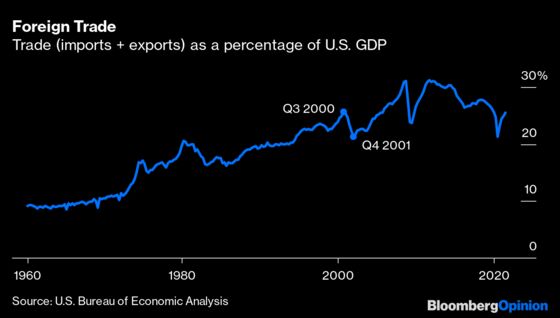
Trade has been on the decline as a share of U.S. GDP for most of the last decade, and one has to think that the global supply chain disruptions of the past year will eventually lead to further declines as some overseas production is “reshored.” The number of international visitors had been flat since the beginning of 2016 as well. One could make the argument based on these statistics that U.S. interconnectedness with the rest of the world is waning, although one would be hard-pressed to tie that directly to 9/11.
Another, narrower measure of U.S. interconnectedness does perhaps provide such a link. The number of refugees admitted by the U.S. fell sharply after 2001 as vetting requirements were tightened, then recovered but never to the average levels of the 1980s and 1990s. Under President Donald Trump it fell to new modern lows.
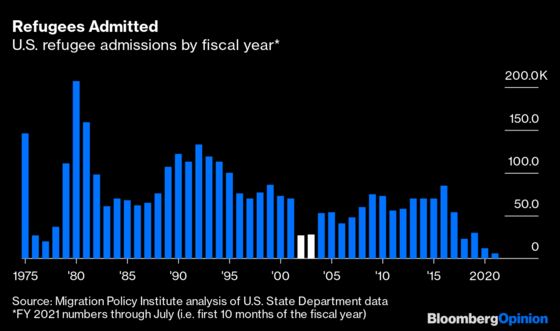
Trump cut refugee admissions so much in large part because he could. Presidents have near-unilateral control over how many refugees are admitted, which is not the case with most other kinds of immigration. But his rhetoric about refugees and immigrants in general could also be traced to 9/11 and the War on Terror that followed, in which recent arrivals, especially from Muslim countries, came to be treated with greatly increased suspicion by the government and many Americans. Then again, last month’s airlift from Kabul is sure to result in a big increase in refugee admissions, which also can be traced directly to 9/11. The reverberations continue, but not always with the effects you might expect.
This column does not necessarily reflect the opinion of the editorial board or Bloomberg LP and its owners.
Justin Fox is a Bloomberg Opinion columnist covering business. He was the editorial director of Harvard Business Review and wrote for Time, Fortune and American Banker. He is the author of “The Myth of the Rational Market.”
©2021 Bloomberg L.P.