Two Big Reasons to Worry About Stocks

(Bloomberg Opinion) -- During the latest earnings season, U.S. companies delivered a message that, on the surface, gave investors reason to cheer: Profits were back to growing again after a year in which they had suffered a decline. But that good news masked a development that suggests Corporate America is beginning what could be a painful adjustment, and one that could put a damper on future stock returns.
With most companies having reported, earnings growth was 0.6% on average, according to Credit Suisse. That was positive, but also puny compared with the 3.2% average growth in revenue. Tighter profit margins were the reason for the disparity; they shrank by 2.5%. And that’s where the trouble lies.
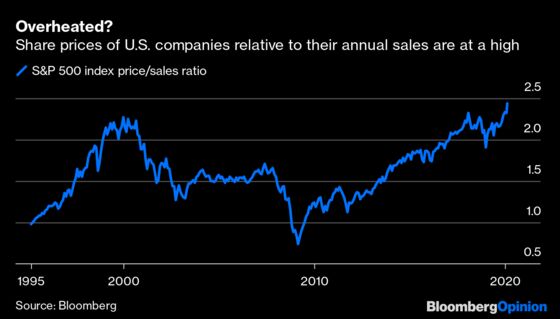
Here’s why. In the years since the global financial crisis, the rally in share prices and earnings has been driven by wide, or widening, profit margins. We can see this by comparing two measures of corporate valuation. First, there’s price-to-sales; it’s one of the simplest metrics of valuation, but also one of the hardest to manipulate. The gauge ignores profitability altogether and just looks at corporate revenue. On this basis, the S&P 500 Index is more expensive now, at 2.43 times sales, than it was even at its peak during the dot-com bubble, when the ratio reached 2.36 times.
This is a very different picture from multiples of earnings, which make the current market look expensive — at about 19 times prospective profits — but nowhere near as over-extended as it was in the early months of 2000, when the multiple peaked at 27 times forward earnings. Widening profit margins are the only explanation for this discrepancy.
Logic dictates, in general, that we can expect profit margins to snap back over time — at least in a market economy. Within the labor market, workers gain negotiating power when unemployment is low and demand a greater share of revenue for themselves, diminishing the dollars companies make on every sale. Healthy profitability can also attract new competitors to a market, who will eat away earnings that way. Or if a company proves so well entrenched (or in Warren Buffett’s phrase, to have too wide an economic moat), there comes a moment when governments are justified in intervening in the market to ensure lower prices or greater competition.
To be fair, the increase in profitability may be at least partly structural in nature. Technological innovations, as we all know, have reduced the amount that companies need to spend on labor. Low interest rates keep the costs of debt down and allow companies to leverage up their profits. But the cyclical market factors that tend to press down on margins haven’t gone away, and the S&P 500 is selling on the assumption that margins will stay high for a long time.
The implications for future stock-market returns are grim, although not disastrous. In a forthcoming article for the Journal of Portfolio Management, New York University’s Thomas Phillips and Adam Kobor show that the price-to-sales measure can work better as a long-term measure of valuations than even the famous cyclically adjusted price/earnings (CAPE) multiple, which compares prices to 10 years’ worth of earnings. The CAPE works on the theory that profits and valuations will revert to a mean over time, and Yale University’s Nobel prize-winning economist Robert Shiller used it to predict the dot-com crash.
Phillips and Kobor have now shown that extremes in the price-to-sale multiple have worked even better than the CAPE at predicting long-term returns. They combine this with research into companies’ management and manipulation of their earnings, which showed that they tend to try to get all their bad news out in one quarter each year. The earnings companies make in their worst quarter each year tend to be extremely volatile, while the earnings in the other three quarters — when they are using accruals accounting to cast themselves in a good light — are much smoother.
The NYU academics put together a new measure that compares share prices both to companies’ three best quarters each year, and to sales. Looking backwards, this measure has worked well for predicting medium-term returns. Based on the current figures, the record high price/sales ratio helps lead them to forecast a nominal total annual return for U.S. stocks over the next decade of about 4.5%. The S&P 500’s annualized total return during the last 10 years was 14.2%, so this is a call for the next decade to be far less profitable than the last, but not a disaster.
Valuation can never help us with stock-market timing. An overpriced market can always become more overpriced in the short term. So the measure gives no insight on how the market will get its 4.5% annualized return between now and 2030. It could be through years of slow growth, or it could take a 30% or 40% plunge followed by a buying opportunity and a recovery.
But with shares now trading at a record multiple of sales, and profit margins beginning to come down from a lofty level, their prediction of much slower stock-market growth over the medium term is hard to refute.
To contact the editor responsible for this story: Beth Williams at bewilliams@bloomberg.net
This column does not necessarily reflect the opinion of Bloomberg LP and its owners.
John Authers is a senior editor for markets. Before Bloomberg, he spent 29 years with the Financial Times, where he was head of the Lex Column and chief markets commentator. He is the author of “The Fearful Rise of Markets” and other books.
©2020 Bloomberg L.P.