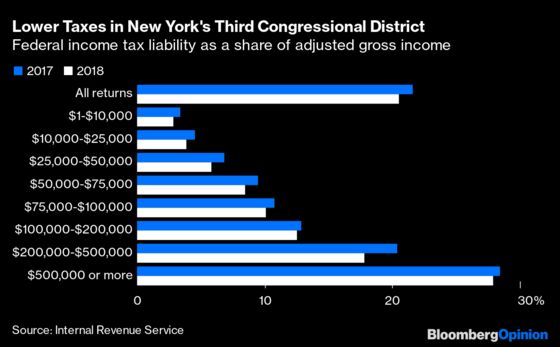
(Bloomberg Opinion) -- The $10,000 cap on federal income-tax deductions for state and local taxes imposed by the Tax Cuts and Jobs Act of 2017 was “a body blow to New York and middle-class families in New York,” in the words of Long Island U.S. Representative Tom Suozzi — the leader of efforts in Congress to repeal the cap.
He may be right about the body blow to the state, or at least the state government. But the 2017 tax law hasn’t harmed most middle-class families in New York or anywhere else, at least not directly. Sure, the SALT cap lost people in Democrat Suozzi’s affluent district $5.6 billion, or about $15,000 per taxpayer, in itemized deductions from 2017 to 2018, according to recently released Internal Revenue Service data, but there were lots of other changes in the tax law that benefited them. Three of the biggest were an across-the-board reduction in income-tax rates, a near-doubling of the standard deduction and a sharp scaling back of the alternative minimum tax. Put it all together, and it turns out that every income group in Suozzi’s district saw its overall federal income tax rate go down from 2017 to 2018.
OK, “every income group” may not be exactly right: I’ve excluded taxpayers with negative incomes because (1) they’re weird and mess up charts with their negative tax rates and (2) there aren’t many of them. More important, the Congressional-district tax statistics don’t separate out those with incomes of $1 million or more. The statistics for states do, and in New York those in that highest income group did see a modest tax-rate increase from 2017 to 2018.
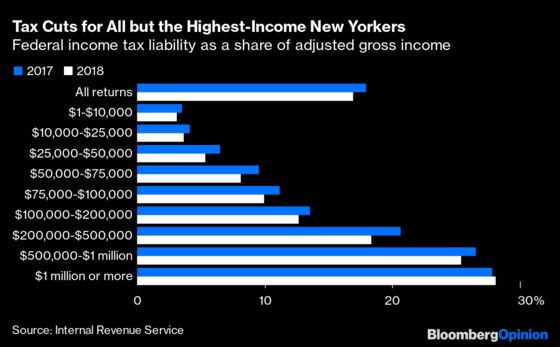
So the 2017 tax law raised taxes for those making $1 million or more in New York while reducing them for every other income group. The top 1% of taxpayers in New York in 2018 were those with adjusted gross incomes of $667,279 or higher, so we’re basically talking about a tax hike for the 1% and a tax cut for everybody else.
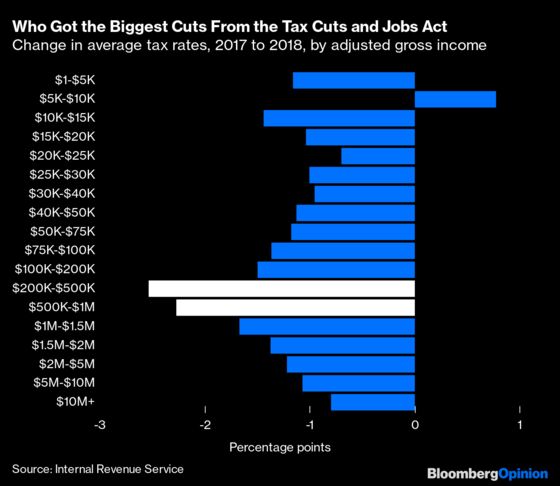
I think it’s fair to say that this is not the standard understanding of the distributional impact of the “Trump tax plan” (as it’s widely known even though former President Donald Trump’s involvement didn’t extend far beyond putting his signature on it). Democrats have for years been pushing the talking point that 83% of the tax cuts in the legislation went to the top 1%, which will be true in 2027 if all the individual tax cuts in the measure are allowed to expire but certainly isn’t the case now. As with any across-the-board income-tax cut, most of the benefits have gone to people who had been paying lots of income tax — that is, those with incomes well above the U.S. household median, which was estimated at $68,703 in 2019. According to estimates made just before the legislation’s final passage in December 2017 by Congress’s Joint Committee on Taxation, more than three-quarters of the aggregate tax savings from the legislation were to go to those making $100,000 or more a year. But they weren’t especially skewed toward the top 1%, with 52% of the tax savings going to those making from $100,000 to $500,000 and the steepest rate cuts for those making between $200,000 and $1 million.
That’s pretty much how things seem to have worked out nationally in 2018, according to IRS data that I wrote about in February under the headline “Trump's Tax Cut Was Very Good to the $200,000 to $1 Million Set.” The column included this chart:
This elicited quite the emotional response from some members of the $200,000 to $1 million set, who emailed and in one case called to let me know that I was (1) wrong, (2) lying and/or (3) mean. Most of these people lived in the New York City metropolitan area, where state and local property and income taxes are quite high, so I did wonder if state- and Congressional-district-level data would paint a very different picture. But it turns out the biggest difference in New York was that those making $1 million or more faced a tax increase rather than the tax cut that their peers in most of the rest of the country received. Those making $500,000 to $1 million also got markedly smaller tax cuts in New York than nationwide, and within Suozzi’s district, the $100,000-to-$200,000 group saw a much-smaller rate cut than nationally and even statewide.
New York is the highest-tax state in the country, according to the Tax Foundation, with a 2019 state and local effective tax rate of 14.1%. I checked the next nine states in the rankings, and Nos. 2 and 3, Connecticut and Hawaii, and No. 8 California had the same pattern of lower effective tax rates in 2018 for all income groups below $1 million and higher for those above, with the biggest rate cut for those making $200,000 to $500,000 a year. In the rest of the top 10, every income group including $1 million-plus saw its effective tax rate go down (although in No. 4 Vermont the decrease for those making $1 million or more was infinitesimal, and in No. 7 New Jersey it wasn’t much), with the $200,000-$500,000 group again getting the biggest rate cuts.
The reason why the $200,000-$500,000 crowd benefited most from the 2017 tax law is pretty simple: It was the group hit hardest by the alternative minimum tax. Congress created the AMT in 1969 with the idea of catching a few very rich people who claimed so many deductions and credits that they paid no federal income taxes, but it wasn’t indexed to inflation so in the 2000s it began hitting what you might call the upper upper middle class, the HENRYs (for “high earners, not rich yet”) or the core audience of business and financial news organizations (hi everybody!). The main way in which it hit them was — surprise! — by disallowing the SALT deduction.
For a married couple filing jointly, the 2017 Tax Cuts and Jobs Act raised the income at which the AMT exemption begins to phase out from $160,900 in 2017 to $1 million in 2018, with inflation adjustments built in after that. The result in New York was that taxpayers in the $200,000-$500,000 income range went from paying an average of $5,617 in AMT in 2017 to paying $51.63 in 2018. They traded the SALT disallowance built into the AMT for a SALT cap on the Schedule A where deductions are reported, and by my rough calculation the result was a wash, while other provisions of the tax law pushed their overall tax bill down further.
Just because members of a group pay lower taxes on average doesn’t mean that every individual member of that group got a tax cut, of course. Tax situations differ, and I’m sure there are significant numbers of people making less than $1 million a year in high-tax states (and especially high-property-tax suburbs) who did get walloped by the SALT cap.
I do wonder, though, how many of the people who think their taxes went up in 2018 even know what their effective 2017 and 2018 income-tax rates were, and how many are instead reacting to the frustration of (1) only being able to put down $10,000 in SALT deductions on their Schedule As and (2) having taxes due in April 2019 rather than the refund they received the year before. This last was in many cases due less to the 2017 tax law itself than to the Trump administration’s subsequent push to reduce withholding in order to get the tax-cut money into people’s pockets quicker. In New York the percentage of taxpayers with taxes due at filing went from 19.6% for the 2017 tax year to 21.6% for 2018, with the increase much bigger for those making $100,000 to $200,000 (29% to 38.5%) and pretty substantial for all incomes above $200,000.
Once again, if you make well under $1 million a year and your tax rate really did go up from 2017 to 2018 because of the SALT cap, I’m not denying that your suffering is real. But you appear to be in a distinct minority even in New York, New Jersey, Connecticut, California and other places whose representatives in Congress are clamoring to repeal the cap. A 2018 analysis by the Urban-Brookings Tax Policy Center found that 56.5% of the benefits from SALT-cap repeal would flow to those in the top 1% of the income distribution; a more recent one by the Institute on Taxation and Economic Policy concluded that 66.8% would flow to White taxpayers making $200,000 or more a year.
This would seem like a strange thing for Democrats to be pushing for — and that’s who is doing most of the pushing, although Suozzi’s new “SALT Caucus” does include a few Republicans from high-tax states. Their reasoning may have less to do with the tax bills of their middle-class constituents than with the financing of state and local governments in the places they represent. In New York, for example, those with adjusted gross incomes incomes of $667,279 and higher (the 1%) generated 43.5% of state personal income-tax receipts in 2018, while personal income taxes accounted for 65% of state tax revenue. The “body blow” that Suozzi and other politicians from high-tax states are really worried about is that enough of these people will leave to put a serious hole in state and local budgets.
Those in the 1% already faced substantial tax incentives to decamp to lower-tax states. But before the SALT cap, lower state and local tax bills in places like Florida and Texas were partly offset by higher federal income taxes because there were fewer state and local taxes to deduct there. Not anymore!
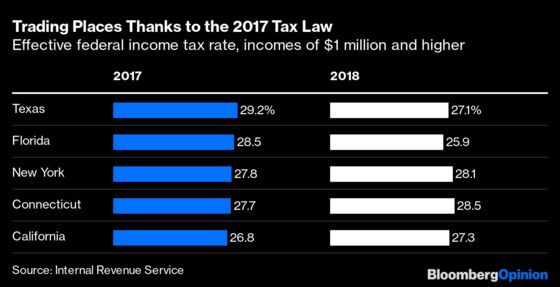
Whether the increased tax differential for very high earners will lead them to depart New York, California and other high-tax states in droves has been the subject of much discussion over the past few years, intensified by the sudden move to remote work caused by the pandemic. Affluent older Northeasterners and Midwesterners have been retiring to warmer, lower-tax climes for many decades. But the last time I checked the data (a little over a year ago, and it hasn’t been updated since), lower-income people fleeing high real-estate prices seemed to make up more of the migration flow out of New York and especially California than possible tax refugees. It is — I hate to say this, but it’s true — too early to tell if that has changed significantly.
In the meantime, though, the SALT cap has definitely made life complicated for Democratic politicians, with Suozzi recently threatening to derail President Joe Biden’s proposed infrastructure-and-tax legislation unless it’s repealed. The Republican chief architects of the 2017 tax law — former House Speaker Paul Ryan, former House Ways and Means Committee Chairman Kevin Brady and former Senate Finance Committee Chairman Orrin Hatch — are all gone from elected office or leaving soon. Their handiwork lives on in interesting ways.
His other key contributions seem to have been the name "Tax Cuts and Jobs Act" (after he originally proposed that it be called simply "Cut Cut Cut") and the 21% corporate tax rate. Before Trump began pushing a corporate rate of 15% in his 2016 campaign for president, Republicans had been aiming at cutting the rate to 25%.
This column does not necessarily reflect the opinion of the editorial board or Bloomberg LP and its owners.
Justin Fox is a Bloomberg Opinion columnist covering business. He was the editorial director of Harvard Business Review and wrote for Time, Fortune and American Banker. He is the author of “The Myth of the Rational Market.”
©2021 Bloomberg L.P.