What Happened to Price-to-Book Ratio in Value Investing?
(Bloomberg Opinion) -- Value investors rarely agree on how to pick stocks. Their objective is generally the same — to buy companies as cheaply as possible — but there’s no consensus about how to measure cheapness. Some look for a high dividend yield, others for a low stock price relative to a company’s assets, earnings or cash flow, and there are numerous variations on those themes.
For most of the past 100 years, it didn’t matter because value stocks paid by any measure. Sure, some value strategies performed better than others, but value stocks almost always beat growth ones and the broad market over multiyear periods, the notable exceptions being the years around the Great Depression in the 1930s and the dot-com bubble in the late 1990s. All value investors had to do was show up.
But the great value bonanza came to a sudden halt just before the 2008 financial crisis. From 2007 to 2020, value lagged growth and the broad market by a crushing margin, and nothing sends investors back to the drawing board like a long bout of disappointment. Every value strategy was scrutinized and challenged, and none more so than the price-to-book ratio.
And that’s no ordinary ratio. The academic research in the early 1990s that documented value’s historical success and thereby popularized value investing used P/B ratio to sort cheap stocks (value) from expensive ones (growth). In simple terms, the lower the stock price relative to a company’s assets minus its liabilities, or “book” value, the cheaper it is. For many investors, P/B became synonymous with value.
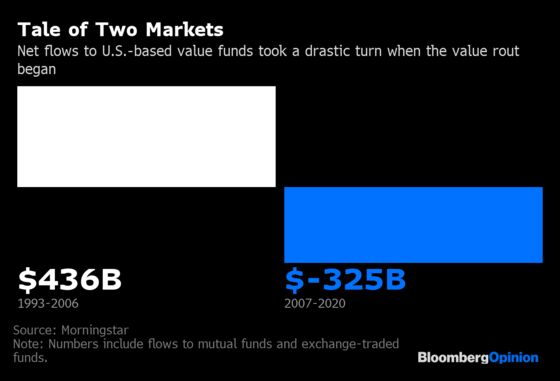
Once word of the so-called value premium got out, investors poured money into value strategies. In 1992, U.S.-based value funds managed about $100 billion, according to Morningstar. From 1993 to 2006, they took in $436 billion, much of it going to funds using P/B ratio to pick stocks.
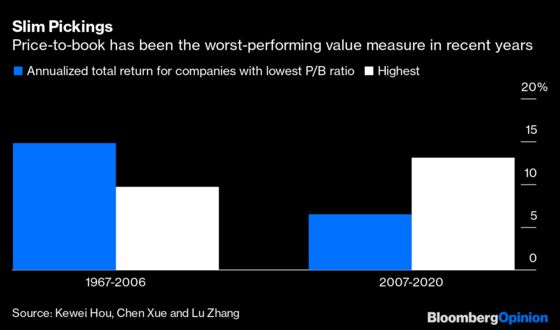
As it turned out, P/B was the worst performer of the value measures during the ensuing 14-year rout. The magnitude of the reversal was truly shocking. From 1967 to 2006, the cheapest 30% of U.S. stocks sorted by P/B and weighted by market value outpaced the most expensive 30% by 5.1 percentage points a year, including dividends, according to numbers compiled by financial economist Lu Zhang and his colleagues. But from 2007 to 2020, the cheapest 30% of stocks lagged the most expensive ones by 6.6 percentage points a year.
Given P/B’s leading role in popularizing value investing, its reversal raised doubts not only about its merit relative to other value measures but about value investing itself. Investors didn’t hang around for answers. They pulled $325 billion from value funds from 2007 to 2020 — three-quarters the amount they had invested during the previous 14 years.
Meanwhile, what was once a leisurely debate about optimizing value portfolios turned into a scramble for answers. P/B’s adherents rushed to defend it, while those who favored other value measures moved to distance themselves from it. All of which raised the question: What happened to P/B?
Its critics say that corporate America changed profoundly and irretrievably soon after P/B rose to prominence in the early 1990s, hurting its ability to spot value stocks. The wave of technology-enabled companies that began in the 1990s and has since accelerated means businesses increasingly rely on software and systems they develop internally through research and development. The problem is that accounting rules don’t allow them to report internally generated assets on their books, no matter how valuable they might be. The omission understates the companies’ book value and therefore overstates their P/B ratio, causing them to appear more expensive than they truly are.
Consider Amazon.com Inc. It developed a process for turning millions of online orders into next-day deliveries, a hugely valuable asset and one of the greatest feats of corporate engineering in history. The value of that innovation is nowhere to be found among Amazon’s assets. If it were, Amazon’s P/B ratio would certainly be a lot lower than 18, which is many multiples the average for manufacturers, banks and energy companies whose buildings, machinery, investments and other traditional assets feature prominently on their books.
That explains why value portfolios that use P/B tend to be light on technology companies and heavy on financials and industrials, a bias that is present but less pronounced in value measures that use earnings, cash flows or dividends. It also explains why P/B has been the worst performer among value measures since 2007, a period dominated by technology.
Even so, what comes next is far from obvious. If history is any guide, technology will not rule markets forever. It’s possible that P/B will stage a comeback and that the last 14 years will prove to be an outlier in what has otherwise been a stellar record. It’s also possible that companies’ reliance on internally developed intellectual property will accelerate, making P/B increasingly unreliable as a value gauge.
Adherents of P/B can hedge their bets by adjusting companies’ book value to reflect all assets, not just those recognized by accounting rules. But that would be arduous and time-consuming, assuming systems, processes and other intangibles can even be valued reliably. Zhang and his colleagues have a simpler solution: Swap book value for operating cash flow. The latter, Zhang says, “is a reasonably good estimate of what P/B would look like if internally developed IP were reflected in book value because operating cash flow captures the value of all assets companies use in their core business, whether or not reflected on their books.”
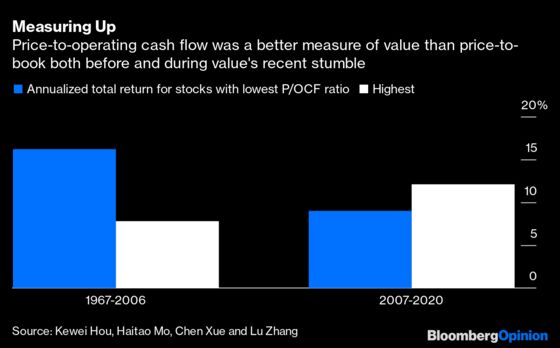
In Zhang’s back tests, price-to-operating cash flow produced value portfolios that were more balanced across sectors, including technology, than those using P/B. As a result, while the cheapest stocks sorted by P/OCF still lagged growth stocks from 2007 to 2020, they held up far better than stocks sorted by P/B. They also outpaced growth and value sorted on P/B by a wide margin from 1967 to 2006.
Value stocks have surged since last November, and P/B has performed as well as any value measure, if not better, which has momentarily quieted the squabble about value investing. But with the proliferation of index funds and ever more data available to investors, there’s a greater diversity of value approaches today than ever before. The argument about how to pick value stocks may just be getting started.
This column does not necessarily reflect the opinion of the editorial board or Bloomberg LP and its owners.
Nir Kaissar is a Bloomberg Opinion columnist covering the markets. He is the founder of Unison Advisors, an asset management firm. He has worked as a lawyer at Sullivan & Cromwell and a consultant at Ernst & Young.
©2021 Bloomberg L.P.