(Bloomberg Opinion) -- There’s simple narrative of inequality in which rich people monopolize the wealth and income, and do nearly all the spending, while poor people struggle for survival.
But in the U.S. today, inequality is more complicated than that. Some people have wealth, others have income and still others are able to spend. These advantages overlap but are far from identical.
That fact is often overlooked in the discussion about inequality. It usually starts with a chart like this one, showing average pretax income by decile from the lowest-income 10% (households with pretax income under $12,103) to the highest 10% (households with pretax income above $166,663). By that reckoning, the top 10% of households enjoy average pretax income 47 times that of the bottom 10%.
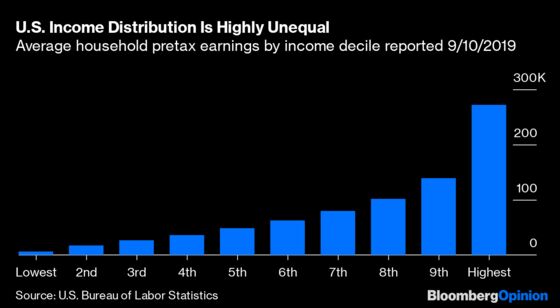
Next, people can adjust for factors that make things more equal. They recognize that take-home pay matters more than pretax income, and that people in higher income deciles pay more in taxes while people in the lower income deciles receive significant government benefits. The trouble with this approach is the adjustments suggest that income redistribution is a cure-all for social and economic inequities.
Suppose that instead of starting with pretax income and working to what households have available to spend, we go in the opposite direction, starting with spending — perhaps a better measure of living standards than income or even wealth. This is shown in the next chart, based on statistics from the latest Bureau of Labor Statistics Consumer Expenditure Survey released Sept. 10, which shows average spending per earner by income decile.
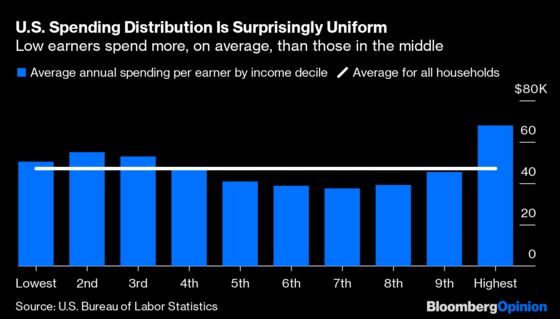
Just as the income chart exaggerates inequality, the spending chart disguises it. But it does suggest that if we take money from the top 60% of earners and give it to the bottom 40%, we’re taking from households that spend less per earner on average than the households that would receive aid. Looked at from that standpoint, income redistribution may not be such a good way to even things out.
One kind of inequality that’s invisible in the spending chart is inequality within each income decile. The numbers shown are averages, and within each decile are households spending more and less. This form of inequality doesn’t separate high from low earners or people with more wealth from those with less. Instead, it distinguishes high-spending households in all income deciles from low-spending households in all income deciles.
In the lowest-income decile, for example, are students with little or no income, who nevertheless spend a lot supported by parents, student loans and prior years’ savings. This pulls up the spending average, disguising the troubles of a minimum-wage, part-time, no-benefits worker trying to support a family. On the other hand, the lowest average spending per earner occurs in the seventh income decile, covering households with pretax income between $70,367 and $88,821. A young, healthy single person earning this amount is probably comfortable, but a family with husband and wife each holding $36,000-a-year jobs could be struggling to make ends meet.
How is it possible that households with less than $12,103 in annual pretax income spend $50,618 per earner? The biggest reason is that more than half these low-income households have no earners, so they do not share in that $50,618.
Households with earners bring in more before taxes than they spend (for one thing, they have to pay taxes), but households with no earners spend considerably more than they earn. Earnings for these households come primarily from pensions (including Social Security), then from government benefits (including negative taxes), then from investment income. Many no-earner households have neither pensions nor investments, and therefore rely exclusively on benefits.
Turning to the high end, how is it that the top 10% of households spend only $67,883 per earner, or $142,554 per household? What about those yachts and private jets, and $10-million dollar parties with rock star entertainers, and mansions in every city? The answer is that there aren’t many people who spend like that, and their consumption does not amount to much in the population statistics.
The biggest problem with drawing policymaking conclusions from the spending data is probably that the charts only show one year’s numbers. Many people in the lower-income deciles have strong lifetime economic prospects — including students and young people starting out in good careers — or can live comfortably off past economic success, such as a retired person who owns a house and a large investment portfolio, carefully managed to produce little taxable income, selling unappreciated assets to cover living expenses. Some people in the higher deciles may have had one good year — people selling small businesses or houses, lottery winners, construction workers during boom times — which must pay for years of lower earnings.
There are policies that seek to improve the lifetime prospects of children who are disadvantaged by disability, poverty, racism or other ills: affirmative action, additional education spending for special-needs students and anti-discrimination laws, for example. But these aren’t mainly about income redistribution even if in some cases they’d rely on taxation to finance helpful programs. Economic inequality is just one part of the social harm caused by these problems, and redistributing income is at best just one part of the solution.
In addition to policies to help people with poor lifetime prospects, there are policies that do the reverse. Social Security, for example, averages earnings over 35 years to determine a recipient’s annual benefit. But that means that benefits are higher for people with higher average incomes. Unemployment compensation similarly helps people with higher average earnings in prior years. So maybe one place to equalize lifetime economic prospects is to get rid of redistribution in the wrong direction.
The biggest purely economic problem hidden in the consumption data is impact on household wealth. The next chart shows how much households were able to add to their net worth over a year. It shows that households in the lowest income decile had to borrow or sell assets to support spending, and the bottom half of households were unable to save much. This is during economic good times with low unemployment and rising asset prices. Many of these households are economically insecure even if their current spending is adequate, and will face problems in the next recession. Moreover, they may find it difficult to climb to financial security.
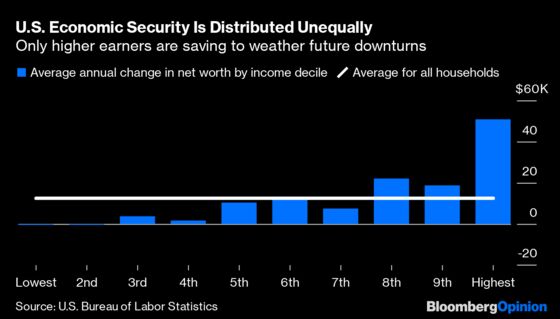
Economic insecurity and lack of assets by households earning less than the median is caused by many factors, with inequality not necessarily the key one. The U.S. already redistributes enough income to allow low-income households to spend more per earner on average than high-income households.
Shoring up government pensions and Social Security is a better path to reducing economic insecurity than raising taxes on the highest earners. Easier bankruptcy laws to protect assets and ease debt burdens would help. Stopping asset seizures from orphans, sick people and non-criminals means fewer citizens impoverished by their government. Cutting back on incarceration, excessive bail, occupational licensing and government funding by fines could help poor people build financial security.
However you feel about any of those proposals, the social problems caused by the U.S. economy have more complicated causes than generalized inequality, and more complex solutions than crude income redistribution. Low-income and high-income people each, on average, consume adequate amounts for dignified comfort. There are plenty of social and economic problems to tackle: people missed by government benefits, economic insecurity even among people with enough to spend today, racism, child abuse and neglect, to name a few. Penalizing rich people won’t make them go away.
To contact the editor responsible for this story: Jonathan Landman at jlandman4@bloomberg.net
This column does not necessarily reflect the opinion of the editorial board or Bloomberg LP and its owners.
Aaron Brown is a former managing director and head of financial market research at AQR Capital Management. He is the author of "The Poker Face of Wall Street." He may have a stake in the areas he writes about.
©2019 Bloomberg L.P.