How California Lost a Million Jobs and Gained $342 Billion
(Bloomberg Opinion) -- From the end of 2019 to the middle of 2021 — the duration (so far) of the pandemic, more or less — the U.S. economy grew at an annualized pace of 0.6%. That masks some pretty big regional divergences, though.
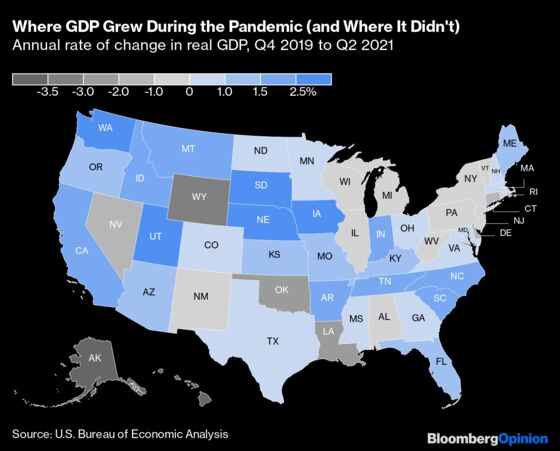
Four of the five worst-performing states, with real gross domestic product shrinking at an annual pace of 2.5% or more, have economies dependent on fossil fuels, the prices of which collapsed early in the pandemic. (The other is tourism-dependent Hawaii.) The recent rise in oil and gas prices will probably boost their third-quarter GDP numbers, which will be released by the Commerce Department’s Bureau of Economic Analysis on Oct. 28 for the nation and Dec. 23 for the states, although probably not by enough to make up for all the lost ground.
The fossil-fuel connection also helps explain why the Texas economy grew less than one-third as fast as California’s, a turn of events not really in keeping with prevailing narratives of shifting economic fortunes during the pandemic. It doesn’t explain why California’s growth handily outpaced Florida’s, though, or why Washington grew fastest of all.
Overall, the U.S. economy’s center of gravity shifted westward during the pandemic. The Northeast’s economy remained smaller in the second quarter than it was before Covid hit, and the Great Lakes region’s barely grew, while growth in the Southeast only modestly outpaced the national average. Meanwhile, every region west of the Mississippi except the hydrocarbon-rich Southwest (Texas is the country’s No. 1 oil producer, New Mexico No. 2 and Oklahoma No. 5) grew at more than twice the national pace.
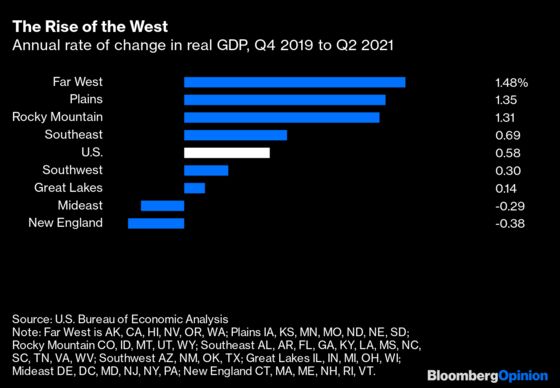
The simplest explanation for all of this is that the West is where the tech industry is concentrated, and tech companies had a great pandemic. The increase in real GDP produced by the Far West’s information sector, which includes software, gaming and most internet enterprises, was greater than the region’s overall GDP gain (offsetting big losses in arts and entertainment, accommodation and food services, and transportation and warehousing). In the Rocky Mountain region, information and finance together led the way. In the Plains states, agriculture accounted for most of the GDP increase. While the percentage gains were similar, in dollar terms the Far West’s real GDP increase was more than twice that of the Rocky Mountain and Plains states combined.
The BEA also produces estimates of personal income and per-capita personal income. These don’t display quite as pronounced a westward tilt over the course of the pandemic, but they do show a gusher of money pouring into California, with an annualized increase of 8.9% in per-capita income since the end of 2019. (Unlike the GDP data this is not adjusted for inflation; the BEA only releases current-dollar quarterly state personal income numbers, and I took that as a sign that I probably shouldn’t try to adjust the numbers myself.)
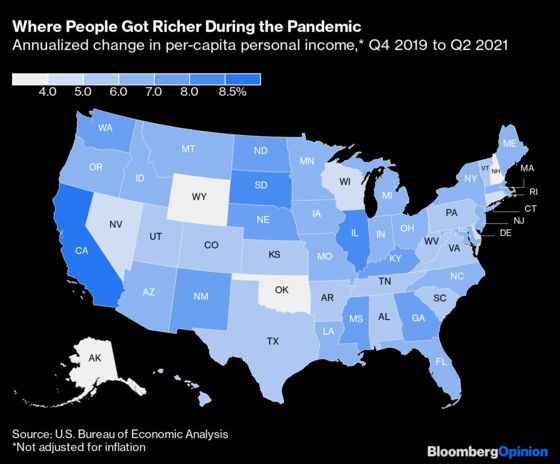
Overall personal income in California was $342 billion higher in the second quarter of this year than in the fourth quarter of 2019. That represented nearly 18% of the nationwide increase, flowing into a state with 12% of the country’s population. A lot of that money surely went to one part of the state in particular — the tech-centric San Jose-San Francisco area, which already had the highest per-capita personal income of any combined statistical area in the U.S. in 2019 (the 2020 sub-state numbers aren’t out yet, and there is no quarterly data). But that’s been enough to boost the state as a whole up the per-capita income ranks, from 13th a decade ago to sixth in the second quarter of this year, behind the District of Columbia, Massachusetts, Connecticut, New York and New Jersey.
Interestingly, all those places except Connecticut also saw healthy growth in per-capita personal income over the course of the pandemic despite weak GDP performance. State GDP estimates are meant to measure where economic activity happens; the personal income numbers reflect where the people benefiting from that economic activity live. They do not include capital gains, so the riches that the past year’s boom in internet-related initial public offerings showered upon venture capitalists, company founders and early employees don’t show up directly — meaning that California’s personal income numbers may sharply underrepresent how much richer the state has gotten. But personal income does factor in dividends, interest, rent and proprietors’ income, so the surprisingly quick financial recovery from the pandemic boosted incomes in places where asset owners congregate. Rich places, that is.
Government aid was a big factor, too. The country’s poorest state, Mississippi, saw the sixth-sharpest per-capita income gain, 36% of which was accounted for by what the BEA calls “other personal current transfer receipts.” In the first quarter, when most of the $1,400-per-person American Rescue Plan payments went out, that share was 82%. Even in far-richer California, unemployment insurance payments accounted for 27% of the income gains.
Another important element in per-capita incomes is population, which in California has fallen by 151,929 people since the fourth quarter of 2019, according to the BEA’s estimates. This doesn’t change the overall picture much, although on a non-per-capita basis South Dakota edges out California 8.9% to 8.6%. Unsurprisingly, South Dakota’s income gains came chiefly from farm earnings, although the state’s rising profile as a tax haven for the very rich can’t have hurt, either.
All of these measures, meanwhile, paint a very different picture from the jobs data that — in part because it’s so much more frequently updated — has informed most of our understanding of the pandemic’s economic impact. As of August (national jobs data for September came out Friday, but state numbers won’t be available till Oct. 22), every state but Idaho and Utah still had fewer nonfarm payroll jobs than it had before the pandemic, with California and New York shedding the most in raw numbers (1 million and 875,500 respectively) and Hawaii and New York the most in percentage terms.
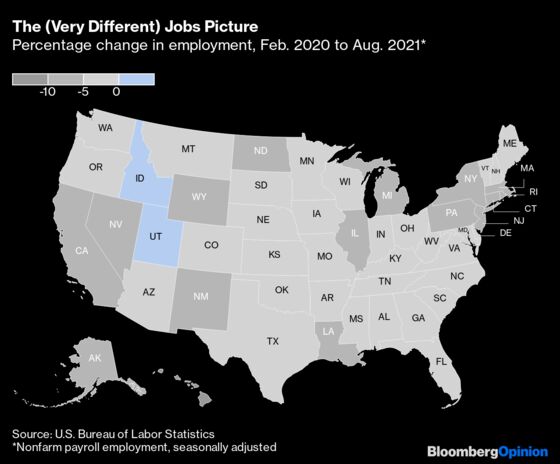
That economic activity and incomes have held up so much better than jobs is testimony to the strange contours of the pandemic recession, which effectively bypassed sectors of the economy that didn’t require much in-person interaction and was met with an unprecedented scale of government aid. Low-wage workers in big, rich cities seem to have borne the brunt of the pandemic’s employment declines because their jobs did require in-person interaction, but because of their low wages they don’t have a big effect on aggregate GDP or personal income. And because of the many federal aid programs they’re not in as much distress as the job-loss numbers indicate.
None of this is to say that the jobs numbers should be ignored. They’re still the timeliest and probably the best measure of regional economic trends. But they’re not the only one, and GDP and personal income point to the continuing strengths of some states that have been hammered on the jobs side.
This column does not necessarily reflect the opinion of the editorial board or Bloomberg LP and its owners.
Justin Fox is a Bloomberg Opinion columnist covering business. He was the editorial director of Harvard Business Review and wrote for Time, Fortune and American Banker. He is the author of “The Myth of the Rational Market.”
©2021 Bloomberg L.P.