How Covid's Toll Compares With Other Things That Kill Us
(Bloomberg Opinion) -- Over the past year the death toll from Covid-19 has been compared to deaths from lots of other causes, ranging from seasonal influenza to war to heart disease to car accidents to swimming-pool drownings.
At 500,000 and counting, U.S. Covid fatalities are now a lot higher than annual deaths from most of those other things. They’re also much higher than any short-term infectious-disease outbreak since the 1918 influenza pandemic, which killed an estimated 675,000 people in the U.S., the proportionate equivalent of 2.2 million in today’s more-populous country. The 1957-1958 influenza pandemic killed an estimated 116,000, the equivalent of 223,000 today. HIV/AIDS has killed an estimated 700,000 Americans, but over four decades.
The overall number isn’t the whole story. Eighty-one percent of U.S. Covid fatalities have been people 65 and older. There’s nothing unusual about this age profile — in fact, the different age groups’ share of Covid deaths is strikingly similar to their share of deaths, period.
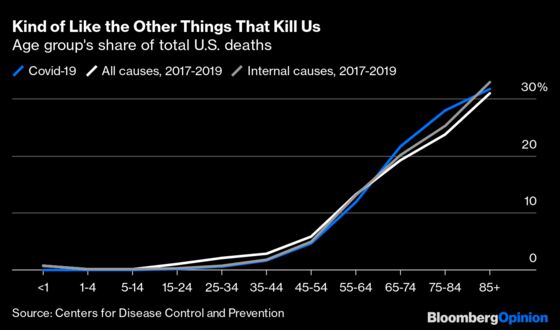
Still, this age distribution is very different from some of the other things that kill us. Past influenza pandemics, for example, often exacted their worst toll among children or young adults. Wars tend to be especially deadly for young adults, for obvious reasons.
I haven’t been able to find data on deaths by age group for past flu pandemics and major wars that match up well with what’s available on Covid-19, but the Centers for Disease Control and Prevention does provide spectacularly detailed data on deaths from every imaginable cause since 1999, making it possible to compare Covid’s toll by age with that of lots of the other risks mentioned above. I already did a version of this exercise back in May, using the age distribution of Covid-19 deaths recorded up to that point by the CDC and estimates for an overall Covid toll of 100,000, 200,000 and 750,000. Now that we know the actual, awful one-year toll of the disease, it seemed worth revisiting.
That 12-month death toll will end up well over 500,000 if one counts from when deaths actually started taking off late last March. Meanwhile, skeptics have pointed to incidents of deaths from gunshots and auto accidents being attributed to Covid as evidence of a major overcount. State and local health officials subsequently removed most such cases from their data, but there were many tougher calls where Covid merely hastened the end of people who were dying of something else. Then again, data on excess deaths from all causes seem to indicate that, especially early in the pandemic, a lot of deaths probably caused by Covid were instead attributed to other things. Which is why I figured I should just stick with 500,000: It’s in the ballpark, and doesn’t imply false precision.
What I’ve done in most of the tables that follow is show the 500,000 deaths based on the age distribution in the February 24 CDC Covid-deaths-by-age report, which lags the totals reported in the media by a few weeks, and compare the resulting deaths per 100,000 in each age group to the annual average for 2017 through 2019 in the CDC’s underlying-cause-of-death database.
Let’s start with seasonal influenza. The death totals most often cited for it — 22,000 in the 2019-2020 flu season, 34,000 in 2018-2019 and 61,000 in 2017-2018, one of the worst flu seasons in decades — are estimates of flu-associated deaths derived from the CDC’s FluView monitoring program and some statistical modeling. They aren’t broken down by detailed age-group, and some health researchers think they dramatically overstate actual influenza deaths. The number of deaths attributed to influenza in the CDC’s underlying-cause-of-death statistics averaged only 7,860 a year from 2017 through 2019, which surely understates the toll because influenza can lead to pneumonia which is then cited as the cause of death. So I’ve followed common practice and used the combined total for influenza and pneumonia, which averaged 54,858 from 2017 through 2019 and certainly overstates flu deaths by a ton but hey what else am I supposed to do.
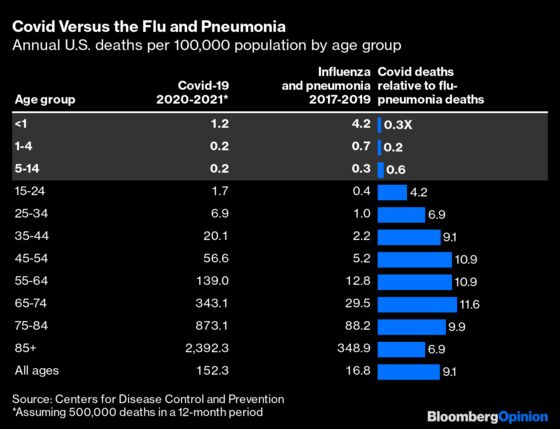
Covid-19 has killed fewer children than influenza and pneumonia usually do. That’s partly because children’s opportunities to catch it were lower with so many schools and day-care centers closed for much or all of the year, but it also does appear that the early consensus that the disease wasn’t very dangerous for kids held up. What’s striking, though, is that Covid flipped to being deadlier than the flu and pneumonia at some point in the teenage years and rapidly turned much deadlier. The relative increase in risk for those 25 through 34 was the same as for those 85 and higher. The younger group’s absolute risk of dying was hundreds of times lower, but compared to the other infectious-disease risks young adults face, Covid has been pretty bad.
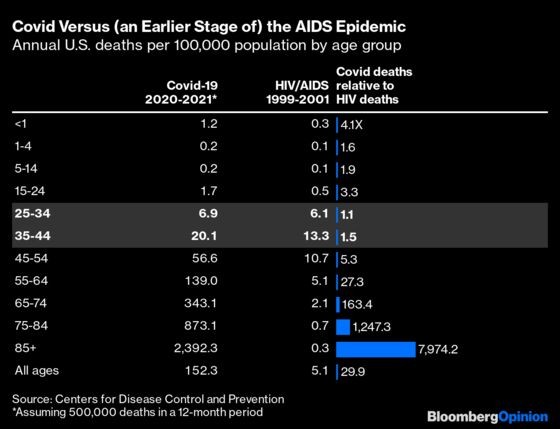
It’s not the worst such risk they have ever faced, of course. The 1918 influenza pandemic hit those in their late 20s hardest of all. While most deaths from HIV/AIDS in the U.S. now are among those in late middle age, that wasn’t so earlier in the epidemic. From 1999 through 2001, annual HIV deaths among those in their late 20s through early 40s were roughly equivalent to the past year’s Covid deaths.
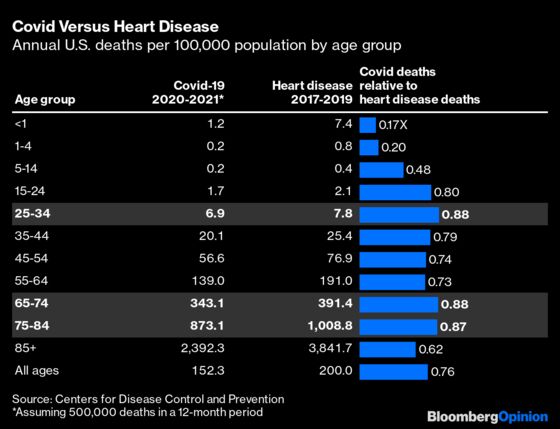
The leading cause of death in the U.S. is heart disease, which with a few exceptions is not infectious. This is why the arguments voiced earlier in the pandemic that we don’t shut down the country for heart disease even though it kills 650,000 people a year never made a lot of sense — we don’t shut down the country for heart disease chiefly because there’s no reason to think shutting down the country would slow the spread of heart disease.
As Covid’s death toll continued to rise, it actually did begin to approach that of heart disease. You may remember headlines in December saying that Covid had passed heart disease as a cause of death, but that referred only to ischemic heart disease, or narrowing of the arteries. Measured against all heart disease, Covid was about three-quarters as deadly. Above age 14 the distribution of deaths by age was pretty similar, with those 25 through 34 and 65 through 84 facing the highest risk from Covid relative to heart disease, and those 85 and older the lowest.
Car accidents were another frequent subject of comparisons early in Covid-19’s rise. They’re not infectious either, strictly speaking. But we do engage in a lot of policy tradeoffs relative to auto safety — speed limits, seat-belt laws, airbag requirements, etc. — that resemble those made over the past year in trying to slow the spread of Covid. There may even be some level of contagion in driver behavior: If more people are allowed to get away with speeding or running red lights, then even more are likely to try it. For comparison I’ve used deaths from all transport accidents on land, which includes a few bike and train mishaps that don’t involve motorcycles, cars or trucks, but not many.
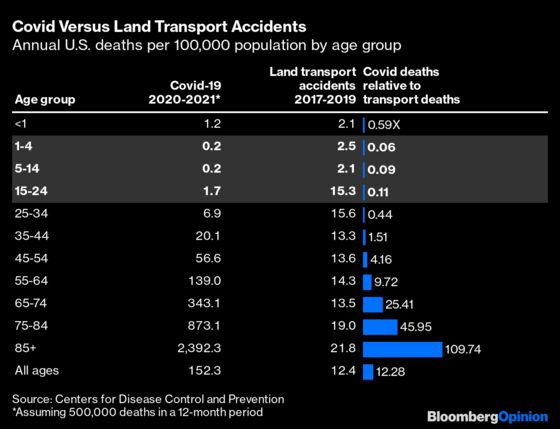
For those ages one through 24, Covid-19 has proved to be only about one-tenth as dangerous as cars and trucks normally are. The 2020 transport-accident statistics may look a lot different with more kids stuck at home and, for a few months at least, far less driving going on. But it’s still jarring how much more risk this country’s children and teenagers face from motor vehicles than from the deadliest pandemic in a century.
This country has been willing to shoulder substantial economic and social costs in recent decades aimed at reducing that risk. The mandating of car seats for children has resulted in a sharp decline in accidental deaths — and probably also a decline in births. Ever-stricter licensing requirements for teenagers have reduced teens’ risk of dying in an accident along with their personal freedom. There is nothing unique about the nature of the tradeoffs we’ve been making in combating Covid-19, even if the scale is unprecedented.
Another real threat to children, small ones in particular, is the swimming pool. Back in April, psychologist and talk show host Philip “Dr. Phil” McGraw generated much mockery with his astonishing claim on Fox News Channel’s “Ingraham Angle” that 360,000 Americans drown in swimming pools every year. In fact the number is a little over 700. Total U.S. drownings in all environments averaged 3,704 annually from 2017 through 2019, and the World Health Organization estimates that more than 300,000 die of drowning globally each year, and it seems that Dr. Phil — who was squinting at his home computer screen when he cited the statistic — just misread one of those. But I’m going to go ahead and compare Covid with swimming-pool drownings because it delivers one remarkable result.
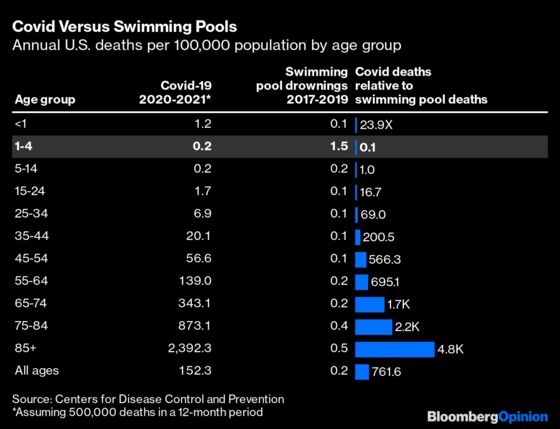
Yes, American toddlers are 10 times likelier to drown in a swimming pool than die of Covid-19. Given that the populace at large is hundreds of times likelier to die of Covid than of drowning in a pool, this seems to have greater implications for pool safety practices than Covid policy. Please close that pool gate, people, and keep an eye on the kids!
Another cause of death that is often thought to skew young, although it doesn’t really, is suicide. Almost 50,000 Americans die every year of what the CDC calls “intentional self harm,” and the rates per 100,000 don’t vary much from age 25 up, apart from an intriguing dip among the 65-74 set. Given that Covid-19’s death risk rises rapidly with age, this does mean that suicide is a much bigger risk for teenagers and young adults than Covid has been.
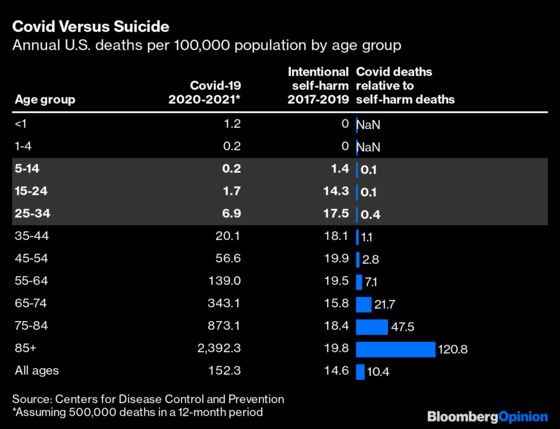
The pandemic and its economic and social side effects have brought increased stress and thoughts of suicide, although evidence is mixed on whether actual suicides are up. This pandemic year has been very hard on a lot of people, and just as the risks of Covid haven’t been shared equally across age groups, the burdens of fighting it surely haven’t been either. I’m not going to attempt any real weighings of those burdens here. I’ve gone on for pretty long already, and all this counting of lives lost is making me so, so sad that I’ve got to think you, dear reader, are ready for a break as well. But I’ll conclude with two charts that together may illustrate the burdens a little better.
If you compare Covid deaths with deaths from all causes in recent years, what stands out is that the relative risk increase imposed by Covid seems to have been highest not for the very oldest Americans but for those aged 65 through 84.
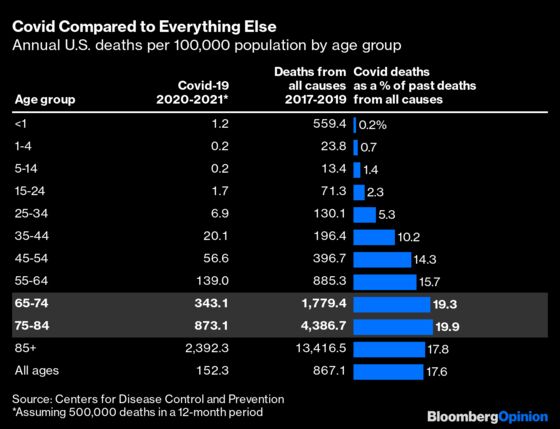
If anything, the percentages in the above column overstate the risk increase for the oldest Americans, because, on balance, the older a Covid victim, the more likely he or she was to have died from something else if there had been no pandemic. One way of getting around this effect is simply comparing deaths from all causes year to year. As already noted, the CDC deaths data takes a while to catch up with reality as some state and local health department reports trickle in especially late (I’m looking at you, North Carolina). But even comparing incomplete, provisional 2020 data with the numbers for 2019 delivers some remarkable results.
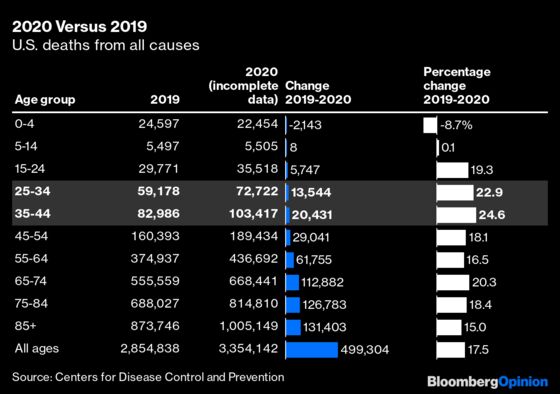
There should be no surprise in the absolute changes here, other than perhaps that they’re so huge. Nearly 500,000 more deaths have been recorded in the U.S. for 2020 than 2019, and they’re not done counting the 2020 deaths. Beyond that, though, the increase in deaths from 2019 to 2020 goes up with age just as the number of deaths does, albeit more slowly. Those 65 and older account for 81% of the deaths from Covid but 73% of the change in deaths from 2019 to 2020.
Part of the explanation for the difference is just that, as mentioned above, many older Covid victims would have died from something else in 2020 if there hadn’t been a pandemic. But there’s also that disturbing bulge in the far-right column of the above chart among those 25 through 44 years of age, who saw the biggest percentage increase in deaths from 2019 to 2020. Only about a quarter of the increase for those ages has been attributed so far to Covid. The absolute number of deaths involved is not very large, but it does indicate that young adults have been subjected to a unique amount of stress this past year.
Two final observations:
- Covid-19 has brought lingering health struggles for many survivors, often referred to as “ long Covid,” that aren’t captured in the above statistics and may affect the comparability with other causes of death. Car accidents injure an estimated three million people a year with lasting consequences for many, meaning that their ratio of long-term disability to death may be similar to or even greater than that with Covid. On the other hand, one doesn’t hear a lot about “long flu.”
- In weighing the costs and benefits of the pandemic-fighting effort it may make more sense to count lives saved than lives lost. One rough-and-ready way to estimate the former is to start with the worst-hit place in the U.S. and calculate how many would have died if the nation as a whole had seen the same rate of deaths. According to the Johns Hopkins Coronavirus Resource Center’s database, the county of more than 25,000 population (I excluded smaller counties to avoid fluke results) with the highest Covid death rate is New Mexico’s McKinley County, aka the Gallup Micropolitan Statistical Area, where 438 of 71,367 residents are reported to have died from Covid, for a rate of 614 deaths per 100,000 people. Applied nationally that death rate would deliver a Covid toll of just over 2 million, or about 1.5 million more deaths than have actually occurred. So there is a case to be made (not a bulletproof one, I’ll admit) for tripling the Covid numbers in all the above tables if you’re trying to judge how much effort was worth expending to prevent them.
I used 2019 population estimates to calculate the Covid-19 death rates; the Census Bureau has released some population estimates by age for 2020 but they are derived differently from those for 2017-2019 and don’t seem entirely compatible. I also considered using the CDC's multiple-causes-of-death database for comparison, since some of the past year's estimated 500,000 Covid deaths will ultimately be attributed to some other underlying cause, but ditched that idea after discovering that while for Covid the underlying-cause and multiple-cause tallies so far are quite similar (the first is 91% of the latter), three times more deaths were reported from 2017 to 2019 with pneumonia as one of multiple causes than with pneumonia as the underlying cause.
This column does not necessarily reflect the opinion of the editorial board or Bloomberg LP and its owners.
Justin Fox is a Bloomberg Opinion columnist covering business. He was the editorial director of Harvard Business Review and wrote for Time, Fortune and American Banker. He is the author of “The Myth of the Rational Market.”
©2021 Bloomberg L.P.