The Durable Goods Boom Is More Sustainable Than It Looks
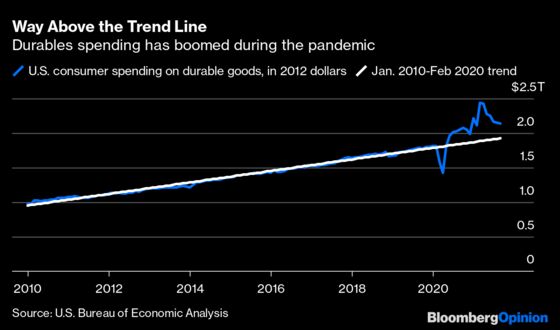
(Bloomberg Opinion) -- Consumer spending on durable goods fell for the sixth month in a row in September, according to inflation-adjusted data released last week. But even with the decline, Americans are still buying lots more video and audio equipment, home furnishings, boats, recreational vehicles and other durables than they were before the pandemic — or than they would have if durables spending had kept rising at its pre-pandemic pace.
The one big exception is motor vehicles, which are responsible for most of the durables decline since spring and of which Americans bought about the same amount in September 2021 as in September 2019. This seems to be due more to supply constraints related to semiconductor shortages than to waning demand, so we can probably expect a rebound in the near future.
After that plays out, though, the obvious takeaway from a chart like the one above is that durable goods spending ought to revert toward the pre-pandemic trend. Maybe not all the way to it: we’ll surely see some permanent shifts in how people spend their money after the pandemic, especially relating to remote work, commuting and such. But durable goods are, at least in theory, durable. People will keep buying cars and dishwashers and SUVs but they don’t need new ones every month. The explosion of durables spending over the past year-plus should thus mean Americans won’t need to buy quite so much in the near future. This is both good and bad news for the economy: it implies that there’s an end in sight for the current supply-chain madness, but it also entails a higher risk of a negative growth shock.
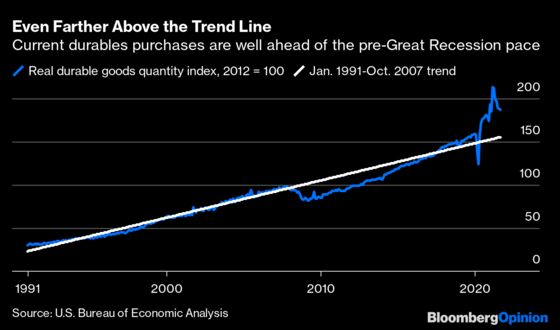
Still, what if the trend line above is the wrong one? It starts in the month that real durables spending bottomed out after the Great Recession and ends the month before the pandemic sent it briefly plummeting once again. But the recovery from the Great Recession was infamously slow and comparatively devoid of that time-honored driver of durable goods spending: young people buying houses. At least, that’s the critique I got from a few readers after I wrote about the current durables spending boom and its sustainability for Bloomberg Businessweek and on Twitter. So I decided to try out some other trendlines.
The Bureau of Economic Analysis only publishes inflation-adjusted durables spending estimates in dollars back to 2002, but does offer indexes going back much farther that attempt to measure changes in the quantities of goods and services people buy. Here’s the real durable goods quantity index compared with the trend from January 1991, when goods purchases bottomed out near the end of the 1990-1991 recession, through October 2007, when they peaked before the Great Recession.
The gaps kept getting bigger as I went back in time (the quantity indexes start in 1959), which didn’t make sense until I remembered the semiconductor effect. These statistics reflect increases in processing power and other such improvements as increases in quantity. To illustrate, here are the changes in the quantity indexes since January 1959 for furniture and furnishings, which don’t have a lot of chips in them, and video, audio, photographic, and information processing equipment and media, which do.
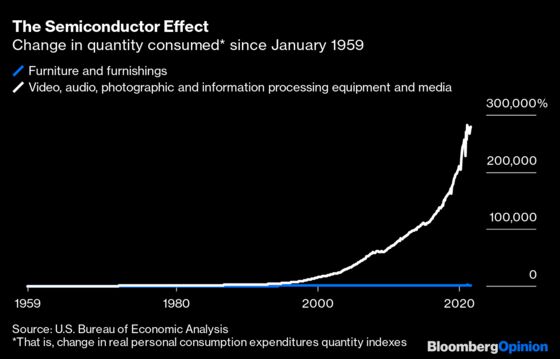
The number of nominal dollars spent on video equipment et. al. has gone up faster than the number of dollars spent on furniture and furnishings too, but only three times faster as opposed to 156 times faster. I’m no inflation truther, and I think the BEA, Bureau of Labor Statistics and other government statistics agencies have to make adjustments for quality improvements. But those adjustments can do some pretty weird things to long-run economic data series, and in the case of durable goods spending they make it really hard to compare the past decade or two with anything that went before.
Inflation does some pretty weird things to long-run economic data series too, which is why government statistics agencies try to adjust for it. But a simpler way to do that for our purposes here is just to measure durable goods’ share of the nominal consumer spending total. Here’s what that looks like since January 1959, together with both the average and the trend line through October 2007.
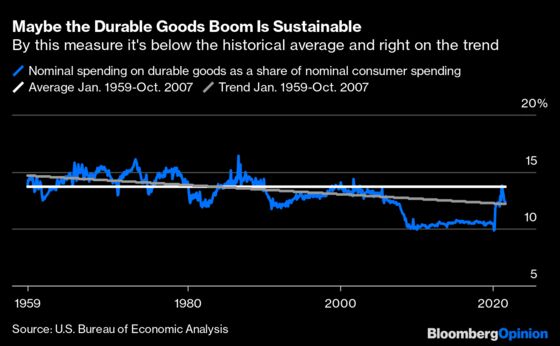
Going by the long-run average, durable-goods’ 12.4% share of consumer spending in September is abnormally low. Going by the trend, it’s just barely above target. If I estimated the trend using a later start date that gap would grow, but pretty much any pre-Great-Recession trend line makes the 2010s look anomalous. Yes, the economic, demographic and technological forces that have been pushing the spending mix towards services and away from goods are not going away. But the shift away from durable goods over the past decade was pretty extreme, and the current boom probably more sustainable than it appears at first glance.
This column does not necessarily reflect the opinion of the editorial board or Bloomberg LP and its owners.
Justin Fox is a Bloomberg Opinion columnist covering business. He was the editorial director of Harvard Business Review and wrote for Time, Fortune and American Banker. He is the author of “The Myth of the Rational Market.”
©2021 Bloomberg L.P.