The Bear Is Back With Less Regard for Sentiment
The market is no stranger to the bear, but as others will undoubtedly point out, a lot has changed since the last one.

(Bloomberg Opinion) -- After 12 long years of hibernation, the bear is back in the U.S. — and this time its run will depend less on sentiment and more on fundamentals.
The Dow Jones Industrial Average closed Wednesday down 20.3% from its record high on Feb. 12, crossing the 20% threshold widely considered the marker of a bear market. The S&P 500 Index dipped into bear territory, too, falling to 2,707 late in the trading day from its record of 3,386 on Feb. 19.
It’s the second longest stretch between bear sightings on record. The S&P 500 last entered bear territory on July 7, 2008, after a 20% drop from its pre-financial crisis peak on Oct. 9, 2007. Only the period between the 1987 crash and the burst of the dot-com bubble in 2000 was longer, by just a handful of weeks.
The market is no stranger to the bear, but as others will undoubtedly point out, a lot has changed since the last one. The explosion of financial technology in recent years has given millions of Americans access to markets for the first time, many of them Millennials and members of Generation Z who have never navigated a severe downturn. And there’s social media, which gives everyone a platform to express their angst and circulate scary charts.
The prospect of millions of inexperienced investors triggered by hyperconnectivity-induced panic sounds like the making of a market crash. And for some, it may conveniently explain the speed of stocks’ recent descent. During the previous bear market, it took 186 trading days for the S&P 500 to decline 20% from its peak. This time it took just 15. But the real threat to markets isn’t individual investors — it’s companies themselves.
In fact, investors have been shockingly resilient since the market began to tumble from its peak on Feb. 19. My Bloomberg Intelligence colleague Eric Balchunas compiles asset flows for exchange-traded funds typically used by traders and asset allocators for exposure to stocks and high-yield bonds. The idea is that traders are regularly in and out of markets, so they value ETFs with the highest liquidity, whereas allocators tend to be buy-and-hold investors, so they value ETFs with the lowest fees.
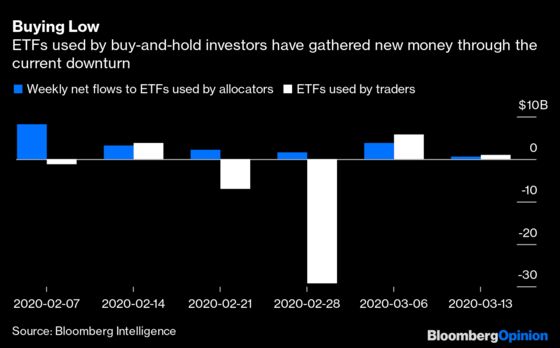
The numbers show that traders have been in and out of markets as expected. But amazingly, the basket of ETFs favored by allocators experienced net inflows every week since the sell-off began, including Monday, when the S&P 500 slid nearly 8%. And this isn’t the first time. There have been four corrections, or market declines of more than 10%, since the numbers begin in 2013. In every case, the basket of ETFs favored by allocators experienced net inflows. So ordinary investors don’t appear to be pushing the market lower.
A better explanation is that other participants such as traders and money managers are trying to anticipate the impact that coronavirus — and possibly other threats such as the escalating oil-price dispute between Saudi Arabia and Russia — will have on corporate earnings. And for good reason. The just-ended bull market was propelled by earnings growth, not by investors piling into stocks. Roughly 80% of the total return generated by the S&P 500 during the last decade can be attributed to higher profits, while valuation expansion, or the willingness of investors to pay more for stocks, contributed just 6%. These days, in other words, as earnings go, so goes the market.
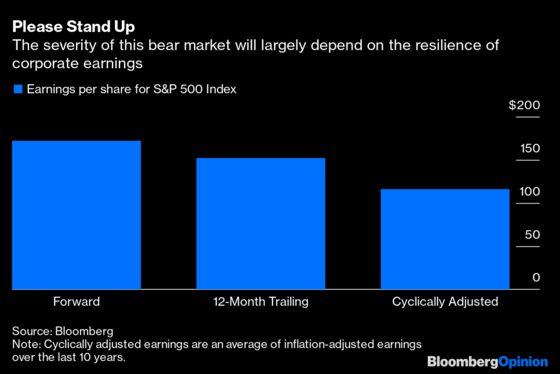
Just how vulnerable are earnings? Even analysts, who are famously reluctant to cut estimates, have been forced to trim their expectations for S&P 500 earnings by 1.6% for 2020, according to numbers compiled by Bloomberg. But the market appears to be signaling a deeper cut. One way to gauge how deep is by holding valuation constant and teasing out what lower stock prices imply about the expected level of earnings. For example, the S&P 500 traded at a forward price-to-earnings ratio of 19.5 at its peak on Feb. 19. Based on that multiple and the index’s intraday low of 2,707 on Wednesday, earnings per share dip to $139, or roughly 10% lower than the S&P 500’s 12-month trailing earnings of $152.
Of course, if the coronavirus outbreak proves to be worse than feared — keeping workers, consumers and revelers at home for an extended period — earnings will almost certainly fare worse. This is where a further adjustment may be prudent, such as the one used in the cyclically adjusted price-to-earnings, or CAPE, ratio. The CAPE calculates the average of inflation-adjusted earnings over the previous 10 years, which often results in an earnings number that more closely approximates long-term earnings growth and thereby anticipates the extent to which current earnings are too optimistic.
By that measure, the earnings target is probably closer to $116, according to Bloomberg data. And again, assuming investors are content to pay 19.5 times for U.S. stocks, that implies a price of 2,262 for the S&P 500, or an additional 18% decline from Wednesday’s closing price.
The magnitude of this bear market won’t be determined by how investors feel but by how companies perform. Every downturn has an epitaph, and this one is likely to be, “Thrive by earnings, wither by earnings.”
To contact the editor responsible for this story: Daniel Niemi at dniemi1@bloomberg.net
This column does not necessarily reflect the opinion of Bloomberg LP and its owners.
Nir Kaissar is a Bloomberg Opinion columnist covering the markets. He is the founder of Unison Advisors, an asset management firm. He has worked as a lawyer at Sullivan & Cromwell and a consultant at Ernst & Young.
©2020 Bloomberg L.P.