(Bloomberg Opinion) -- Pop quiz for all the homeowners out there: If someone were to rent your home today, how much do you think it would go for monthly, unfurnished and without utilities?
Got your estimate? Are you 100% confident in your answer?
This is not an easy question, nor an intuitive one. For many Americans, it would be simpler to just estimate the market price of their home. And yet it’s verbatim what the Labor Department asks in its Consumer Expenditure Survey, which in turn plays a huge role in calculating relative weightings in the crucial U.S. consumer price index. That’s because CPI considers housing as an investment good and not something that’s consumed (that would be shelter, “the service that housing units provide”). But economists can’t just ignore it altogether, so they attempt to get around this distinction by coming up with what’s known as “owners’ equivalent rent,” informed by responses to that one question.
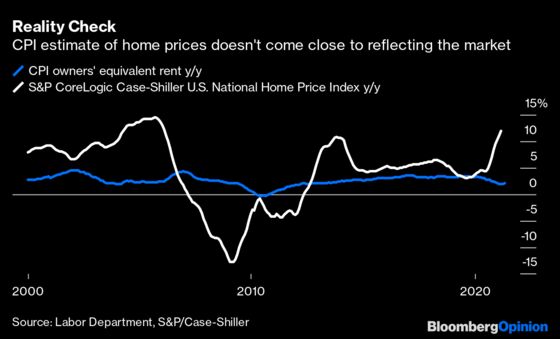
Unsurprisingly, Americans are slower to adjust their expectations for a hypothetical rental price of their home than the housing market is to react to dynamic changes in supply and demand. Owners’ equivalent rent increased 2% in April from a year earlier, according to Wednesday’s CPI report, little changed from the prior three months and close to the slowest annual growth since 2012. By contrast, data from the National Association of Realtors this week showed that the median price for a single-family home in the U.S. rose 16.2% in the first quarter from the same period in 2020, the most on record and in line with just about every measure of the housing market. This kind of wide discrepancy, unseen since the mid-2000s housing bubble, could have significant consequences for reported inflation statistics and monetary policy in the world’s largest economy.
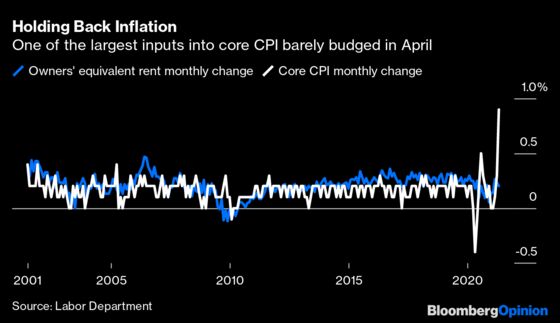
Housing is a big part of overall measured inflation. Owners’ equivalent rent makes up one-fourth of CPI on its own, according to the Labor Department’s latest relative importance of components data, a larger share than food and energy combined. Those are stripped out for the core measure of price growth that the Federal Reserve prefers, meaning the pickup in homeowners’ perceptions for how much they could get in rent will go a long way toward reaching the central bank’s goals.
The thing is, using just about any time frame, owners’ equivalent rent understates the price appreciation in the housing market relative to the S&P CoreLogic Case-Shiller U.S. National Home Price Index. In the past decade, the hypothetical figure is up 31.5% while the latter has soared 73.3%. Over 30 years, the trend is about the same. More recently, owners’ equivalent rent increased 0.2% in April from the prior month, compared with a 0.8% jump in headline CPI and a 0.9% surge in the core measure. It’s never been that low relative to core CPI in at least the past two decades.
It’s not as if the Fed is oblivious to the rapid appreciation in home prices. “The housing sector has more than fully recovered from the downturn,” Chair Jerome Powell said last month at a press conference. While he acknowledged that “it just is going to be that much harder for people to get that first house,” the central bank is showing no signs of reducing its purchases of mortgage-backed securities and appears content to let the wealth effect for current homeowners, driven by its policies that suppress long-term interest rates, help drive the post-pandemic recovery.
Now, the Fed prefers to look at a different measure of inflation anyway: the personal consumption expenditures price index. But CPI is linked to bond market measures of inflation expectations, which the central bank also watches closely. And it stands to reason that if the tide starts to turn on owners’ equivalent rent, keeping CPI elevated, that will feed into the national psyche and drive up survey-based measures of expected price growth as well, which policy makers have also worried were falling too far.
At what point will homeowners’ boost how much they could charge for rent? History suggests perhaps never. Consider that in late 2005, the S&P CoreLogic home price index was up almost 15% year-over-year and that at one point in early 2009, the same index tumbled almost 13%. In each of those periods, owners’ equivalent rent rose on a year-over-year basis. Even though housing prices began to tumble in 2006, 2007 and 2008, the hypothetical component of CPI never had a down month. In fact, it experiences little volatility at all.
I’m going to stop short of calling this calculation completely bogus — but it’s hard to make the argument that it reflects economic reality, either. More likely, homeowners simply aren’t well equipped to estimate how much rent they could get for their residence relative to yearly swings in its market price. The idea of renting property during a pandemic also might skew the data. And all of this is to say nothing of the complex formulas employed by Labor Department economists. So the figure ticks higher each month, in strong housing markets and weak ones, either moving in line with overall inflation or trailing it. Even if it started to climb faster, in line with any measure of U.S. housing prices, there’s always the chance that one-off spikes in categories like used cars and trucks, airfares and hotel costs will fall back to more normal levels.
There are always questions when it comes to inflation. But it’s the Labor Department’s rent hypothetical that should receive extra scrutiny as the U.S. embarks on an unprecedented and untested economic recovery.
This column does not necessarily reflect the opinion of the editorial board or Bloomberg LP and its owners.
Brian Chappatta is a Bloomberg Opinion columnist covering debt markets. He previously covered bonds for Bloomberg News. He is also a CFA charterholder.
©2021 Bloomberg L.P.