The $100 Trillion Bond Market’s Coronavirus Mayhem in 13 Charts

(Bloomberg Opinion) -- If I had to summarize this past week in the $100 trillion global bond market, it’d be fairly straightforward: Traders are enormously fearful of what the coronavirus outbreak will mean for the world economy and adjusting their positions accordingly.
Yet somehow, that feels like a vast understatement. From U.S. Treasuries to leveraged loans, and municipal debt to Austria’s century bond, the last several trading sessions have resulted in a blizzard of headlines proclaiming broken records and the wildest market swings in years. It’s anyone’s guess whether such extremes can continue. That’s because so much is uncertain when it comes to the coronavirus, its potential spread, and what monetary and fiscal authorities will need do to mitigate the economic fallout.
Bond markets, even more than stocks, are pessimistic about the outlook. Here are 13 charts that show some of the creeping doom-and-gloom and the overall mayhem across Wall Street trading desks in the last several days.
The trip across bond markets has to start with 30-year Treasuries:
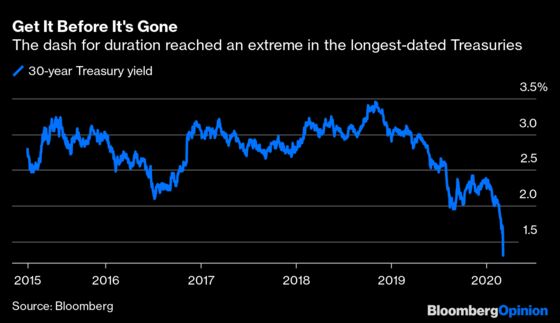
The “long bond,” as it’s known, captivated traders throughout the week, but it reached a crescendo on Friday. While U.S.-based investors slept, the yield plunged by 28 basis points in one of the steepest declines since around the financial crisis. Even a blowout jobs report did nothing to stop the relentless buying — the yield touched as low as 1.1846%, down almost 40 basis points in the span of 24 hours and half of what it was at the start of 2020. The rally was reportedly so intense that CME Group Inc.’s circuit breakers were triggered four times on 30-year bond futures.
The insatiable demand for Treasuries was hardly limited to the longest-duration assets. Five-year Treasuries yielded about 1.4% on Feb. 19 when the S&P 500 set a record high. By week’s end, the yield fell below 0.5%:
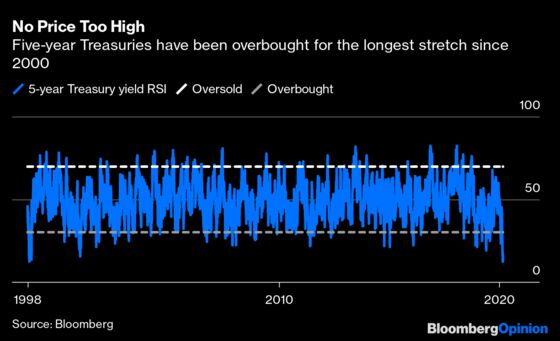
How extreme was this rally? According to relative strength index analysis, the five-year note has been “overbought” for 10 consecutive trading days, the longest stretch for the maturity since 2000. It reached the most extreme overbought level since 1998 on March 3 after the Federal Reserve’s emergency interest-rate cut of 50 basis points.
Those dynamics in short- and long-term debt combined to create a wild ride for any trader betting on the shape of the yield curve:
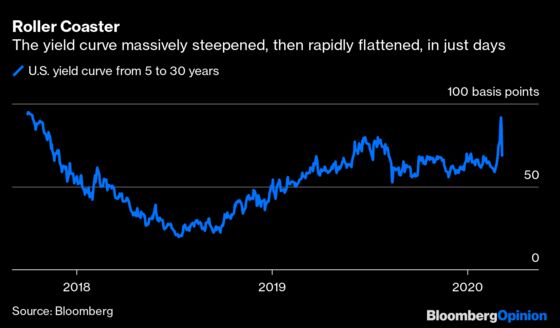
The Fed’s rate cut initially caused the curve to steepen, with the spread between five-year and 30-year Treasuries reaching the widest since October 2017. But then the mad dash for duration took hold toward week’s end, flattening the yield curve by 19 basis points, the most for a single day since September 2011.
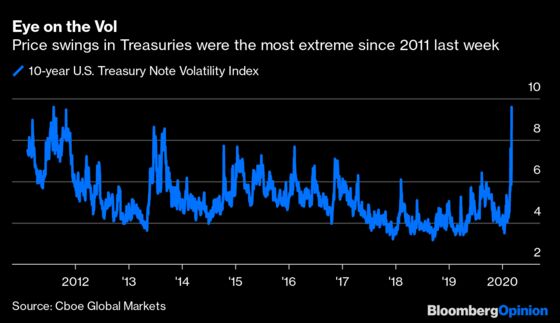
The stock market’s fear gauge, known as the VIX, gets a lot of attention. But it has a lesser-known bond-market cousin: The Chicago Board Option Exchange’s 10-year U.S. Treasury Note Volatility Index, known by the ticker TYVIX. Like its better-known counterpart, the TYVIX surged last week to the highest level since 2011, in the wake of S&P Global Ratings taking the unprecedented step of downgrading America’s credit rating:
The massive rally in U.S. Treasuries has ripple effects across all bond markets. One that’s particularly sensitive to the level of benchmark yields is the $3.8 trillion municipal market. Investors in state and local government debt like to measure the ratio of tax-exempt muni yields to the taxable Treasury rates as a gauge of relative value. Since Donald Trump was sworn in as president, that ratio has been reliably below 100 for two-year, five-year and 10-year maturities. That snapped this past week as munis couldn’t keep up with the flood of cash coming into Treasuries:
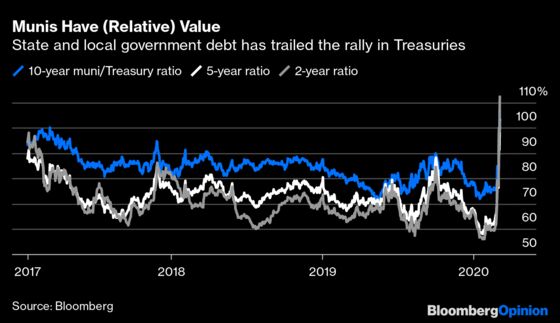
Top-rated 10-year munis now yield 0.9% tax-free, which is equivalent to 1.44% on a taxable basis for those in the top federal tax bracket — or double the going rate on a 10-year Treasury note. That apparently wasn’t a strong enough pitch, as investors pulled money out of muni mutual funds for the first time in more than a year.
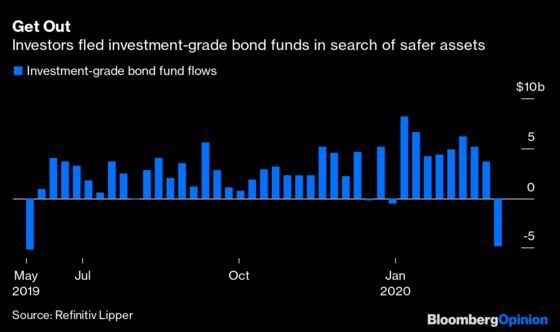
It could be worse for muni money managers — they could oversee funds that buy U.S. corporate bonds and loans. Overall, investors yanked the most cash from U.S. credit funds in a decade in the week through March 4, according to Refinitiv Lipper data. Investment-grade funds lost $4.8 billion, those buying junk bonds saw $5.1 billion of withdrawals and leveraged-loan portfolios had a $2.3 billion exodus.
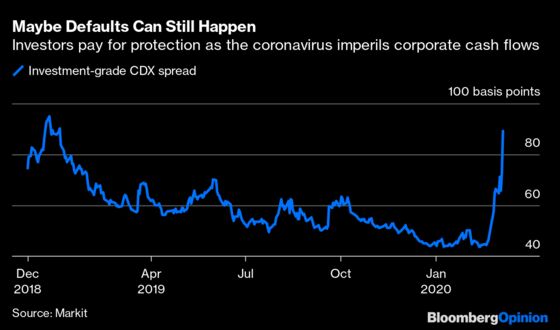
At first glance, that might seem like a hasty decision. After all, Bloomberg Barclays indexes tracking high-yield and investment-grade corporate bonds posted positive returns last week. But that was more a reflection of the overall drop in Treasury yields. The Markit CDX North American Investment Grade Index tells a different story. The index, which measures the perceived overall risk of corporate credit, jumped on Friday by the most since at least 2011 in a sign that investors are starting to get anxious about potential defaults after years of tranquility:
These fears are obvious when looking at the spread between double-B and triple-B corporate bond yields. I wrote about this gauge, used by DoubleLine Capital Chief Investment Officer Jeffrey Gundlach, in a Feb. 26 column. The difference blew out to 181 basis points just two days later, marking the biggest gap since mid-2016:
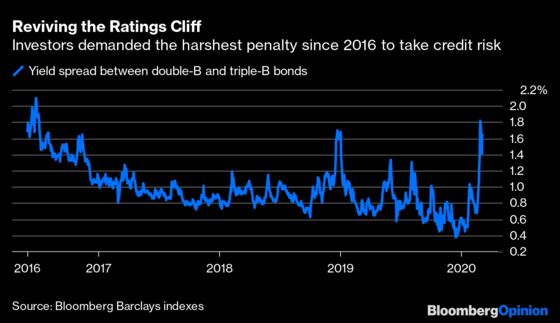
For most of 2019, traders didn’t seem to notice a difference between the two ratings tiers, even though double-B is considered junk and triple-B is investment grade. Now that the prospect of a global downturn is top-of-mind, they’re starting to get picky again and prioritizing debt from more creditworthy companies.
Leveraged loans look just as bad, if not worse. The price of leveraged loans, as measured by the S&P/LSTA Leveraged Loan Index, tumbled to 94 cents by week’s end, from 96.75 cents as recently as Feb. 23. That’s the lowest since the tail end of the December 2018 sell-off in risky assets:
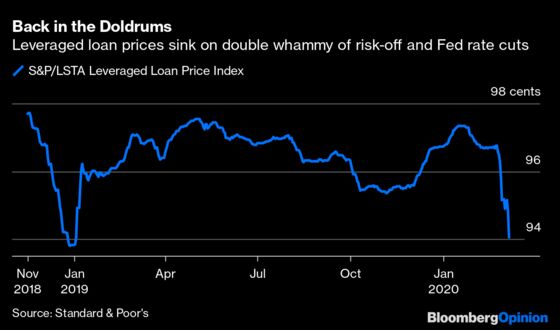
The floating-rate debt had steadily gained heading into 2020 on the expectation that the Fed would hold interest rates steady this year. Obviously, that’s not the case anymore. Those losses are starting to show up in the price of the double-B tranches of collateralized loan obligations, too. A Palmer Square Capital Management Index shows prices are at a three-month low.
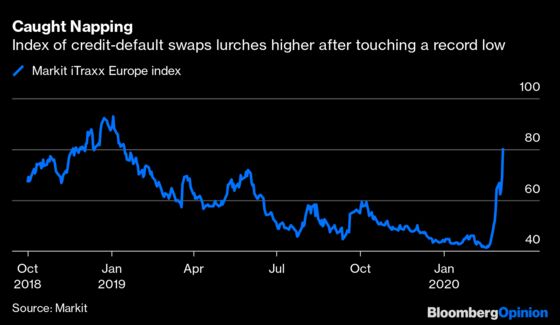
The credit markets are just as dicey over Europe. The Markit iTraxx Europe index spiked higher on Friday to 80 basis points, capping a massive surge from a record-low 41 basis points on Feb. 17. It was higher in early 2019 before coming down to Earth. But like other metrics, it reflects how widespread complacency about credit risk was easily shattered in just a couple of weeks.
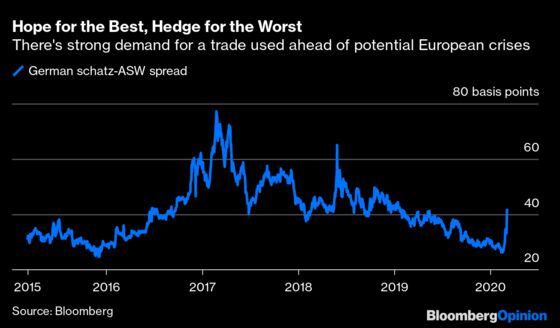
Bond traders in Europe are also turning to another favorite form of protection against recession, Bloomberg News’s John Ainger and Stephen Spratt noted on Friday. They’re buying short-dated German bonds versus interest-rate swaps, since the former benefit from haven demand while the latter carry credit risk. The gap between them reached the widest in more than a year. This kind of extreme move happened in 2017 when it looked like the far-right Marine Le Pen had a chance to win the French election in 2017 and during Italy’s budget dispute in 2018.
No matter where you go across the world, even outside the direct gravitational pull of the European Central Bank, it’s getting harder to find sovereign debt with yields exceeding 1%:
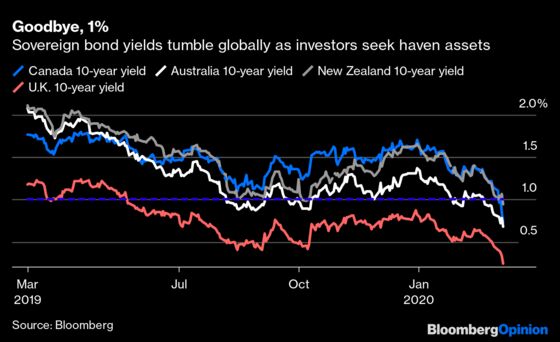
In Canada, after its central bank followed the Fed by cutting interest rates by 50 basis points, the 10-year yield tumbled to 0.7%. In Australia, its 10-year debt yielded in excess of 1% on Feb. 20; it’s 0.68% now. It took until Friday in New Zealand, but its 10-year sovereign yield dropped to 0.96%. U.K. gilts haven’t yielded more than 1% since May — but they dropped to an all-time low 0.24%.
Finally, there’s Austria’s century bond, a favorite in some circles to gauge market sentiment. The debt, which matures in 2117, yields a record-low 0.475%:
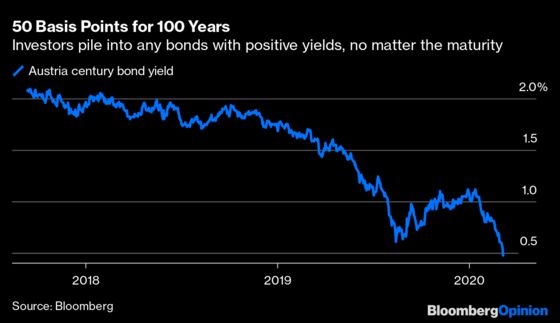
My Bloomberg Opinion colleague Marcus Ashworth asked “what madness is this?” when the bond yielded 1.2%. Now it offers less than half that. Bond traders were left asking the same thing after this past week.
To contact the editor responsible for this story: Beth Williams at bewilliams@bloomberg.net
This column does not necessarily reflect the opinion of Bloomberg LP and its owners.
Brian Chappatta is a Bloomberg Opinion columnist covering debt markets. He previously covered bonds for Bloomberg News. He is also a CFA charterholder.
©2020 Bloomberg L.P.