These Four Charts Show Some of Bitcoin’s Potential Trouble Spots
Bitcoin's downward trajectory since hitting highs in November may still have some more momentum.

(Bloomberg) -- Bitcoin is down about 40% from its November record and there is increasing evidence the decline may not be done yet.
The largest cryptocurrency has failed to gain momentum in every attempted rally in the past couple of months, and dropped Friday to nearly $41,000. The latest declines come after minutes of the Federal Reserve’s December meeting showed a potential for earlier- and faster-than-expected rate increases, as well as considerations about balance-sheet runoff.
Lack of interest and demand due to the holiday season, tax-based selling and concern in the markets about the Fed’s potential actions are resulting in turn-of-year weakness, said Vijay Ayyar, vice president of corporate development and international at crypto exchange Luno in Singapore. He expects levels between $38,000 to $40,000 to come into focus.
Here are some key charts that show the significance of Bitcoin’s move and where it might head next.
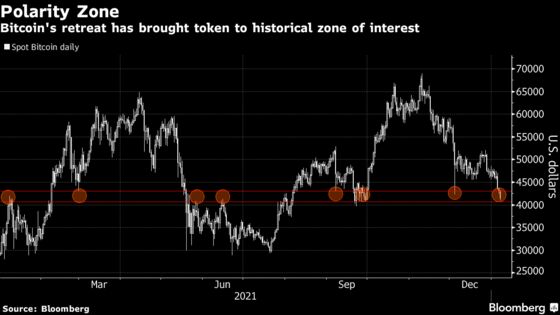
Interest Zone
The area spanning $40,600 to $43,000 is a so-called polarity “zone of interest” where prior resistance has become future support and vice versa. Over the last 12 months, Bitcoin has reacted in this zone on a number of occasions. A drop below $40,600 would signal further weakness.
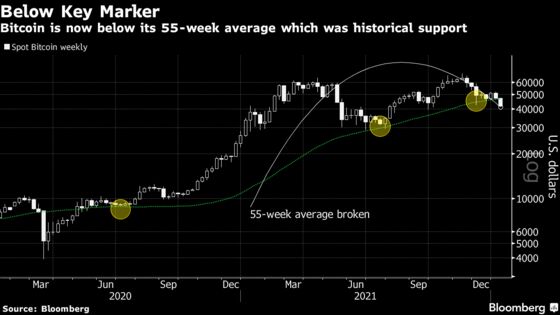
Below Average
Over the past two years, Bitcoin’s declines have found support at the 55-week simple moving average, currently at around $46,000. The bear market between April and June that shaved 56% off the token’s price bottomed there, as did the early December weekend flash crash. The ongoing slide has pushed prices below this key average.
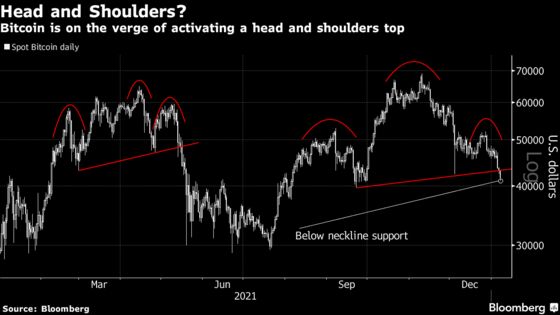
Head and Shoulders
A so-called head-and-shoulders top may have been already activated with Friday’s decline. A similar pattern occurred between the February-to-May period, with the token dropping from nearly $65,000 to $28,800. Bitcoin has currently broken the neckline -- if it is pressured further and takes out polarity support at $40,600, the measured objective calls for a test of $26,000 with an invalidation at the right shoulder high of about $52,200.
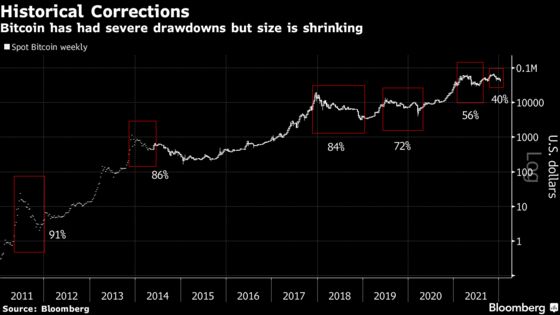
Deep Corrections
In the last decade, Bitcoin has undergone six large corrections, including the current one. Each time, the dip has been smaller than the last, for instance the 2021 version resulted in a 56% decline. Market watchers should pay attention to $30,000, the point where the slide from the record high of nearly $69,000 would be equal in size to the previous correction.
©2022 Bloomberg L.P.