What Google Data Tells Us About India’s Economic Recovery
A series of high-frequency indicators show India’s economy is struggling to win the adverse hit from the world’s biggest lockdown.

(Bloomberg) -- India’s economy is struggling to overcome the adverse hit from the world’s biggest lockdown, a series of high-frequency indicators show.
From power consumption to jobs to Google’s mobility trends, the figures show activity has picked up from the record slump registered in April, but the recovery has a long way to go.
In the absence of official figures, economists are increasingly turning to alternative data sets to get a better sense of how Asia’s third-largest economy is coping with the coronavirus pandemic. The strict stay-at-home measures have almost paralyzed official data collection, with the government failing to publish headline consumer price figures for April and May. The last report on factory output data was for March, with the statistics office suspending field surveys because of the lockdown.
On Friday, the government published industrial output data for May that showed a “graded pickup” in activity from April, but it cautioned against comparing the index with months preceding the Covid-19 outbreak. Even though India has eased some of the pandemic restrictions, curbs on movement in so-called containment zones mean the statistics surveys haven’t yet resumed everywhere.
Here’s a look at some of the key high-frequency indicators being tracked and what they say about the economy.
Stringency Index
The Oxford Stringency Index for India collects publicly available information on 17 indicators of government responses to the pandemic. Eight of the indicators record information on containment and closure policies, such as school closures and restrictions in movement.
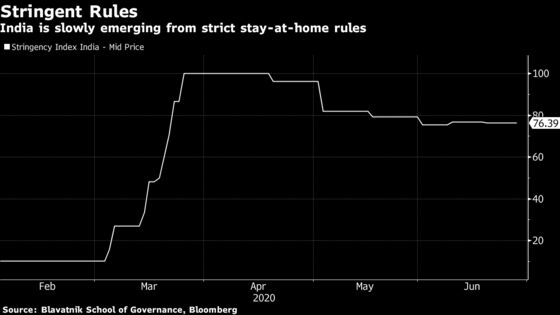
Four of the indicators record economic policies, such as income support to citizens or provision of foreign aid, and five indicators record health system policies such as the virus testing regime or emergency investments into health care.
After declining slightly at the beginning of June, the index has been relatively flat around 76 for most of the month. Bloomberg Economics’ Abhishek Gupta sees only a marginal easing in the index going forward given the latest incremental relaxation of restrictions.
INDIA INSIGHT: Cases Rise, Recovery Stalls - Virus Dashboard (1)
Power Consumption
Electricity consumption is a widely used proxy to gauge demand in India’s industrial and manufacturing sectors. The figures show a sharp slump in demand for power after the lockdown was imposed, and a slow comeback since then.
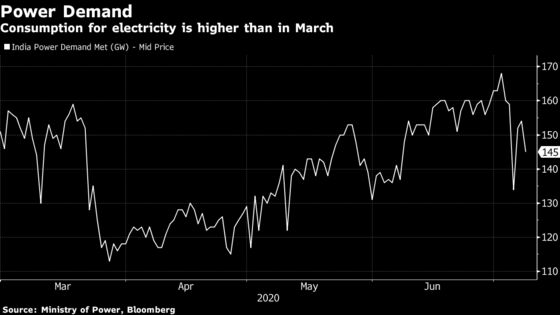
According to the index, derived from data from India’s Ministry of Power, demand flattened during the week ended June 28, and was down 7.4% from a year earlier, marginally higher than the 7.3% drop in the prior week, according to Bloomberg Economics.
Jobless Rate
Many economists have started tracking the weekly unemployment data from the Center for Monitoring Indian Economy for early indications on how the job market is faring. In the immediate aftermath of the lockdown, the CMIE estimated a ‘mind-boggling’ 122 million jobs were lost in the economy and the unemployment rate hit more than 27%.
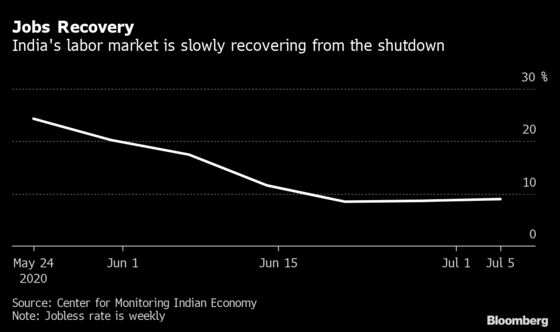
After declining steadily since then, the latest data shows the unemployment rate ticked up to 8.9% in the week ended July 5 from 8.6% in the week prior.
Google Mobility
This tracker is turning out to be a favorite for many economists. Anal Ghosh, senior program manager at Google India, told Bloomberg Quint the report is aimed at researchers to help them understand human mobility for predicting epidemics, urban and infrastructure planning, and understanding peoples’ response to conflict and natural disasters.
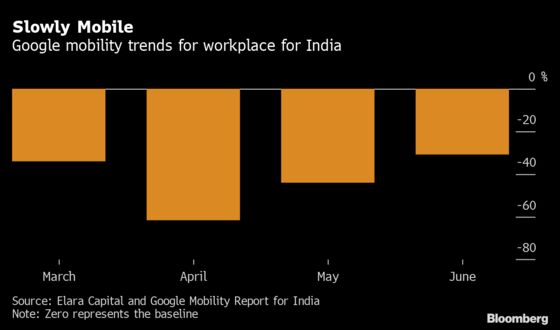
The latest data shows that as the lockdown has lifted, the improvement in workplace mobility has been uneven. While there’s been a pickup since April, the average was still 30.4% below the baseline in the first half of June, according to Garima Kapoor, an economist at Elara Securities Pvt Ltd.
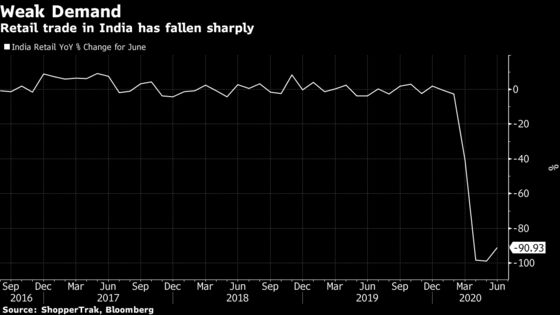
Retail Spending
The number of consumers visiting retail stores surged in June from the previous month as retailers slowly began reopening, according to data from ShopperTrak. But compared with a year earlier, footfalls are still down more than 90%, according to the data. ShopperTrak’s index is based on inputs from collection devices in the retail marketplace and shopper visits.
Loan-Deposit Ratio
Bank deposit growth outpaced that of loans in both April and May, in a clear indication that investment activity has taken a back seat. That trend extended into June, according to data from the central bank. So for every 100 rupees in deposits, banks have 74 rupees in loans, down from 76.4 in March.
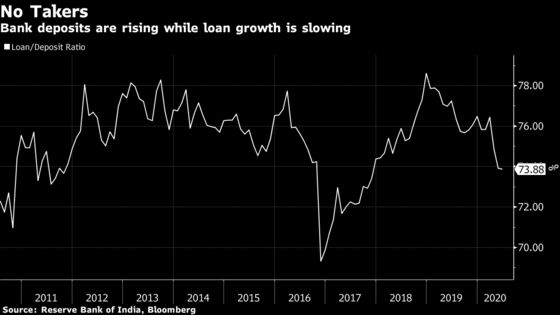
“The sharp fall in the loan-to-deposit ratio may reflect both a fall in credit demand and banks’ risk aversion to lend percolating from the large Covid-19 shock,” economists at JPMorgan Chase and Co. said in a recent note.
©2020 Bloomberg L.P.