Treasury Yield-Curve Mavens Are Pining for Guidance From Fed
Treasury Yield-Curve Mavens Are Pining for Guidance From Fed
(Bloomberg) -- Bond traders who’ve built careers on anticipating how Federal Reserve policy shifts will play out for short- and long-dated Treasury yields are stumped, with scant hope that next week’s policy meeting will clear things up.
As expectations mounted for at least four Fed rate increases this year, short-dated yields rose the most, flattening the curve, a typical pattern during monetary-policy normalization periods. The trend stalled when the central bank broke with tradition, saying its balance sheet might start shrinking shortly after the first rate hike. That’s viewed as likely to steepen the curve.
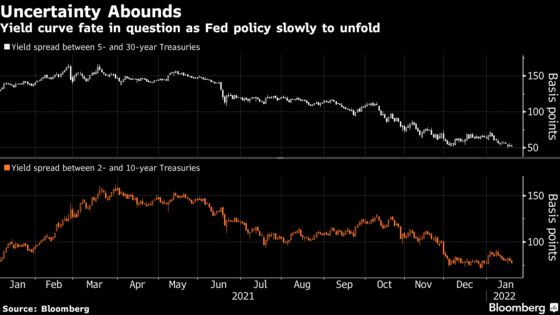
Bets on a narrowing gap between five- and 30-year Treasury yields have been winning since early 2021. After reaching a multi-year high of 167 basis points in February, it collapsed to below 50 basis points this month, a level last seen during the market mayhem of March 2020. Fed policy aimed at throttling inflation is manna for the flattener trade -- except to the extent that balance-sheet management foists a bigger share of the supply of Treasury notes and bonds onto private investors at lower prices and higher long-term yields.
“For steepening to really have legs, it would take the Fed relying more heavily on its balance sheet to convey monetary policy as opposed to the fed funds target rate,” said Zachary Griffiths, strategist at Wells Fargo Securities. He predicts the curve will end the year flatter as the Fed relies mostly on rate hikes to tighten financial conditions.
Fed policy makers, slated to conclude a two-day meeting on Wednesday, are expected to signal they’ll raise rates in March for the first time in more than three years and start shrinking the balance sheet soon after. The primary mechanism for balance-sheet reduction is curbing reinvestment of cash from existing holdings of Treasuries as they mature.
The last time the Fed undertook so-called quantitative tightening, or QT, from 2017 to 2019, it had been raising rates for more than a year. That’s left bond-market participants unsure what to expect. Interest-rate futures are pricing in a peak of around 1.75% in the Fed’s policy rate, but the forecast is vexed by uncertainty about the interplay between rate hikes and QT.
The implications for the yield curve have been complicated in the past week by speculation that the Fed could kick off the hiking cycle with a half-percentage-point increase, something it hasn’t done in more than two decades. Wagers on that outcome didn’t last long, and a 25 basis-point increase is heavily favored.
| Related stories |
|---|
| Bond Dealers Are Mapping Out How Fed Will Shrink Balance Sheet |
| Treasury Options Flow Points to Profit Taking on Bearish Plays |
| Fed Will Find It Hard to Talk About Path Ahead After March Hike |
| Rate Hikes to Help Regional Banks More Than Wall Street Giants |
The yield differential between two- and 10-year notes, more sensitive to immediate Fed policy shifts, narrowed to around 75 basis points as two-yield yields topped 1% for the first time during the pandemic.
“The market is getting way ahead of itself in terms of pricing in hikes,” said Peter Yi, director of short-duration fixed income and head of credit research at Northern Trust Asset Management. He expects the yield curve to keep flattening, led by long-dated yields declining as Fed tightening curbs growth and inflation begins to moderate.
Part of the rationale for starting QT sooner than in the past is the curve itself, Fed communications show. The minutes of the most recent policy meeting in December revealed concern that a relatively flat yield curve posed financial stability risks to lenders, and could be averted by relying more on balance-sheet contraction than on rate hikes.
Beyond the uncertainties about how the hiking cycle and balance-sheet reduction will unfold this year, yield-curve calculations are muddled by the extraordinary conditions the Fed is laboring under.
The central bank’s balance sheet is approaching $9 trillion, roughly double its size during the previous QT episode. There’s a chance the Fed will eventually move beyond securities runoff to outright sales, strategists at BMO Capital Markets say.
With inflation rates also at historic levels, the prospect that the policy rate will need to rise more than expected and possibly exceed 3% to have an effect is a key threat to the curve-flattening trend, said Don Ellenberger, senior portfolio manager at Federated Hermes, which manages about $634 billion in assets.
“This will be a tough year for investors,” Ellenberger said. “The Fed wants to bring inflation to its 2% target without hurting growth and the stock market.”
What to watch
- Economic calendar:
- Jan. 24: Chicago Fed national activity index; Markit manufacturing and services PMIs
- Jan. 25: FHFA house prices; S&P CoreLogic house prices; Conference Board consumer confidence; Richmond Fed manufacturing index
- Jan. 26: MBA mortgage applications; advance goods trade balance; wholesale, retail inventories; new home sales
- Jan. 27: Jobless claims; durable/capital goods; GDP; personal consumption; GDP price; core PCE; pending home sales; Kansas City Fed manufacturing
- Jan. 28: Employment cost index; personal income/spending (includes PCE deflator); University of Michigan consumer sentiment
- Federal Open Market Committee meeting on Jan. 25-26 is the only event on the Fed’s calendar
- Auction calendar:
- Jan. 24: 13-, 26-week bills; 2-year notes
- Jan. 25: 52-week bills; 5-year notes
- Jan. 26: 2-year floating-rate notes
- Jan. 27: 4-, 8-week bills; 7-year notes
©2022 Bloomberg L.P.