Oil Charts Show Markets Thrown Into Disarray After Saudi Attacks
After Monday’s shock-and-awe, when crude prices soared the most on record, traders are taking a step back to assess what’s next.

(Bloomberg) --
After Monday’s shock-and-awe, when crude prices soared the most on record, traders are taking a step back to assess what’s next. These four charts show how the sudden loss of 5% of global crude production following the attacks over the weekend is starting to play out in oil markets.
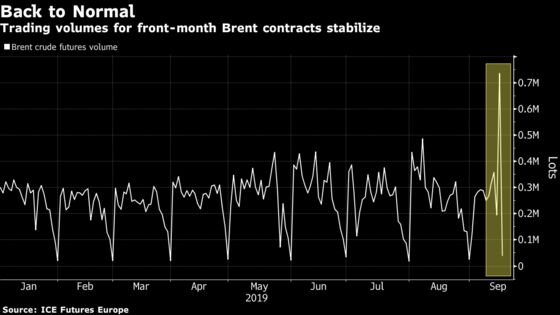
After a massive jump in volumes for front-month Brent futures on Monday, trading returned to more normal levels as the market waited for details about how fast Saudi output will come back. There were 26,142 lots traded for the November contract as of 3:30 p.m. in Singapore, down from 143,618 at the same time on Monday. Saudi Aramco is growing less optimistic that there will be a rapid recovery in production, but it has told several Asian refiners their contracted volumes will be fulfilled, albeit with a different mix of grades.
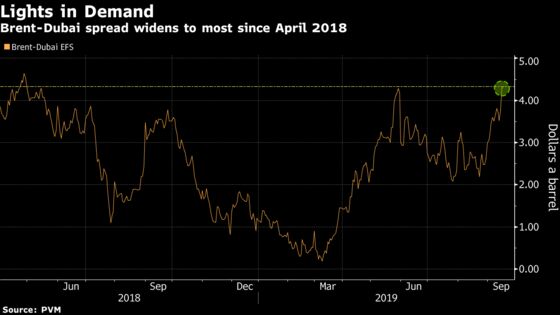
Arab Light and Arab Extra Light are the grades most affected by the Aramco outages, which have crimped supply of less-sulfurous crudes that are mainly produced in Russia, the U.S., the U.A.E. and the North Sea. That’s reflected in the premium of the lighter Brent to heavier Dubai oil, which widened to the most since April 2018. The latest offers for Abu Dhabi’s Murban crude have doubled from last week, according to traders who asked not to be identified.
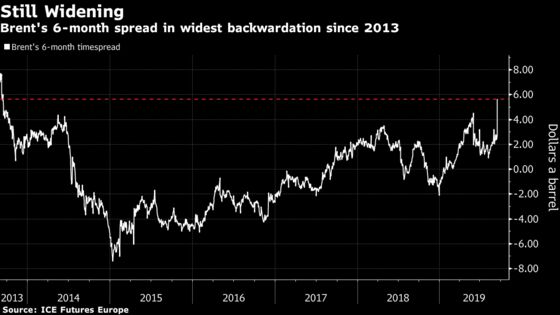
The attacks have turbocharged the premium for prompt to later-dated supplies as refiners scramble to make up for the lost Aramco barrels. The backwardation of Brent’s six-month spread went from $2.70 a barrel on Friday to $5.57 on Monday, and then rose above $6 on Tuesday. That’s the widest backwardation -- which indicates tight supply -- in six years.
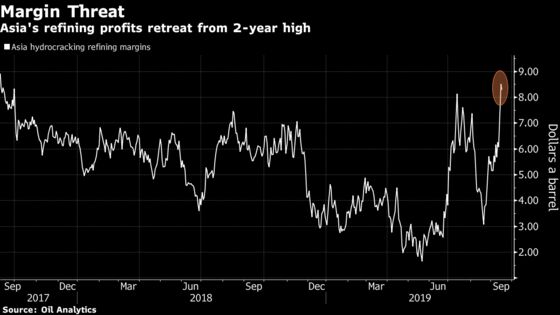
Profits from processing Dubai crude into petroleum products in Asia retreated on Monday but are still at the highest level in almost two years, Oil Analytics data show. Margins have shot up in the last few weeks due to strong seasonal demand for gasoline and diesel. But they’re likely to come under pressure if crude prices remain elevated or push even higher due to the attacks.
--With assistance from Dan Murtaugh.
To contact the reporter on this story: Sharon Cho in Singapore at ccho28@bloomberg.net
To contact the editors responsible for this story: Serene Cheong at scheong20@bloomberg.net, Andrew Janes, Heesu Lee
©2019 Bloomberg L.P.