More Cooling, Less Heating and (Maybe) Less Energy Use
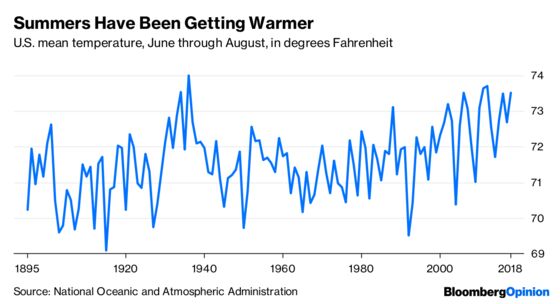
(Bloomberg Opinion) -- Last summer was quite hot in many parts of the U.S., although it wasn’t a record-breaker for the country as a whole. The National Oceanic and Atmospheric Administration’s National Climatic Data Center is currently offline due to the government shutdown, but I downloaded some statistics a few weeks ago and they show June through August 2018 to be the sixth-hottest three-month period since 1895, which is when the data series begins.
Another important temperature metric — the number of population-weighted cooling degree days — did hit a new all-time high for the 12 months ending in September.
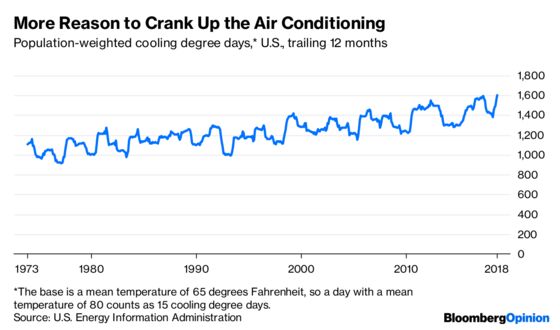
Yes, “population-weighted cooling degree day” is a mouthful, but it’s quite useful when contemplating electricity demand for air conditioning. A cooling degree day reflects how far a day’s mean temperature is above 65 degrees; as it says on the chart, a day with a mean temperature of 80 counts as 15 cooling degree days. The U.S. Energy Information Administration (which is funded via a fiscal 2019 appropriations bill that was passed by Congress and signed by the president in September and thus boasts a website as full of data as ever) tracks this by Census division, then comes up with a national number by assigning population weights to each of the nine divisions.
The rise in the number of cooling degree days has thus been driven partly by rising temperatures and partly by the tendency of Americans since the spread of air conditioning to move to where it’s warmer.
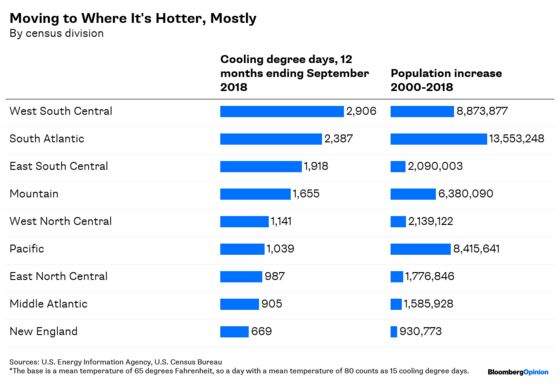
I realize that air conditioning isn’t exactly top of mind in the U.S. in January, although last January the South Atlantic states (which run from Delaware to Florida) did still manage 21 cooling degree days. I became curious about the topic while doing a piece on U.S. electricity use for the back page of this week’s Bloomberg Businessweek. Here’s a more detailed version of the chart that ran with it.
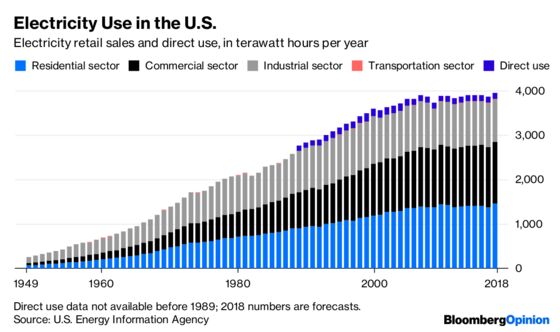
The big story here is that, after rising steadily for the entire 20th century — with occasional brief breaks for recessions — electricity use in the U.S. has been more or less flat since 2007. I’ve written about this electricity plateau and its causes and consequences before. What’s new is that the EIA is projecting a 2.3 percent increase in electricity use for 2018, the biggest rise since 2010’s post-recession bounceback. At this point it’s way too early to say with any confidence why this has happened or even whether it marks a significant departure from the recent (flat) trend. Still, given that the 2018 increase has been driven mostly by residential electricity consumers, I couldn’t help but dwell on the possible impact of air conditioning, which is the single biggest residential electricity use, at an estimated 15 percent of the total.
We live in an age when (1) temperatures have been rising, (2) Americans have been moving to hotter places and (3) new houses have been getting bigger. All three of those should be expected to drive up air conditioning demand. Increasingly efficient air conditioners have tempered the impact on electricity use — according the Department of Energy, “Today’s best air conditioners use 30 percent to 50 percent less energy to produce the same amount of cooling as air conditioners made in the mid 1970s.” But still, the continued rise of air conditioning sure seems like it ought to be putting some upward pressure on electricity demand.
That said, it may not be putting upward pressure on energy demand.
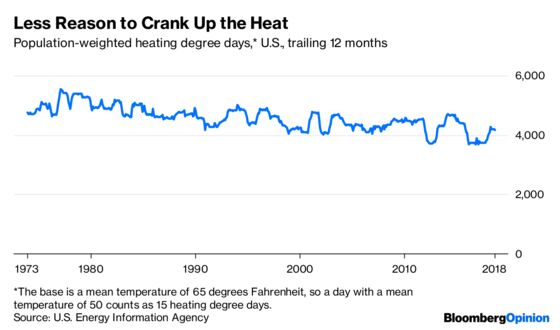
Heating degree days are the flip side of cooling degree days. That is, every degree that a day’s mean temperature is below 65 counts as a heating degree day. And for the same reasons that cooling degree days are on the rise (rising temperatures and population shifts), heating degree days have been on the decline. Electricity powers only 36 percent of U.S. primary home heating systems (natural gas powers 51 percent), according to the EIA’s 2015 Residential Energy Consumption Survey, so less heating and more cooling could mean an increase in electricity use. But overall, as energy and transportation researcher Michael Sivak concluded in a 2013 paper, heating uses far more energy in cold cities than air conditioning does in warm ones. That’s partly because cold winter temperatures in the Northern U.S. depart more from the 65-degree baseline than hot temperatures in the Southern U.S. do (note that even now there are more than twice as many heating degree days in the U.S. as cooling degree days), but also because air conditioners are more energy efficient than furnaces and boilers.
What I take from all this is that electricity use may be on the rise again. There’s also reason to think, though, that some of that rise will involve siphoning demand away from other energy sources. There’s the heating-versus-air-conditioning dynamic that’s already been discussed, with the added twist that electricity has in recent years overtaken natural gas as the main heating source in new homes. Then there’s the rise of electric cars, which not only shifts demand away from oil to electricity (which in the U.S. is currently generated mainly by burning natural gas and coal, although renewables’ share has been rising fast) but could result in less overall energy use because electric motors are more efficient.
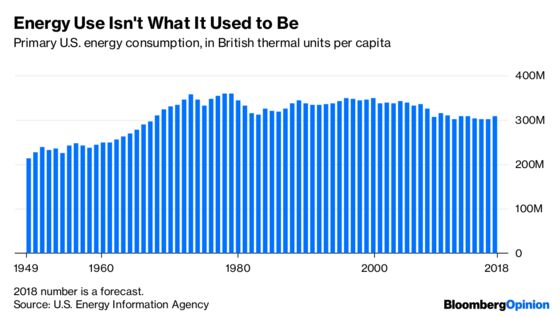
Per capita energy use in the U.S., which peaked in 1979, is also projected to have jumped in 2018. The residential-consumer-driven rise in electricity use was part of that. So were increases in industrial energy use (mainly natural gas and petroleum products) and consumption of diesel and jet fuel (but not of gasoline). Those feel like byproducts of what’s starting to look like a cyclical peak in economic growth. But let’s see what 2019 brings.
No, the y-axis here doesn't go to zero, but there's absolutely no reason why it should in a temperature chart. Should the base be the (arbitrarily determined) zero degrees Fahrenheit? The freezing temperature of water (32 degrees Fahrenheit)? Absolute zero (−459.67 degrees Fahrenheit)?
Electricity consumption data starting in 1902 is available online from the U.S. Census Bureau as part of the "Historical Statistics of the United States, Colonial Times to 1970," but it isn't entirely compatible with the EIA's numbers, so I didn't include it in the chart.
If electric cars become much cheaper to buy and operate on a per-mile basis than those powered by gasoline or diesel, as seems likely to happen eventually, people may drive more miles. Then again, if the U.S. population keeps concentrating in large metropolitan areas, traffic may become more of a constraint on driving than operating costs.
To contact the editor responsible for this story: Jonathan Landman at jlandman4@bloomberg.net
This column does not necessarily reflect the opinion of the editorial board or Bloomberg LP and its owners.
Justin Fox is a Bloomberg Opinion columnist covering business. He was the editorial director of Harvard Business Review and wrote for Time, Fortune and American Banker. He is the author of “The Myth of the Rational Market.”
©2019 Bloomberg L.P.