A New Metric to Figure Out the Most Effective Ways to Cut Carbon
McKinsey & Co. created a chart that lays out dozens of solutions available to cut greenhouse gas emissions.

(Bloomberg) --
In 2007, McKinsey & Co. created a chart that the management consultancy claims has “helped countries and businesses create strategies to address climate change.” The single graphic lays out dozens of solutions available to cut greenhouse gas emissions and how much it will cost to deploy them.
Unsurprisingly, it’s an unwieldy graphic:
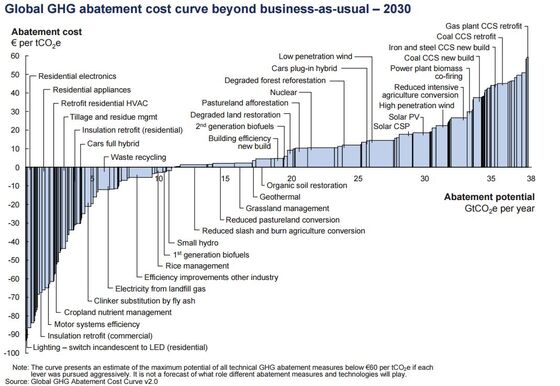
Though interesting, Columbia University researcher Julio Friedmann argues it’s no longer very useful. Technologies have progressed a lot in the past decade, drastically changing how much some solutions cost. The cost of avoiding the emission of a ton of carbon dioxide using a particular strategy is averaged across the world, masking huge variations. It’s also not clear from the chart how using one intervention might affect others. Energy efficiency measures, for example, can sometimes cause what economists call a “rebound effect,” and actually lead to an increase in the use of energy.
Another criticism of the chart is that simply putting a price on carbon is not enough. McKinsey attaches negative carbon prices to many measures, which it says means they save money and cut emissions in the long-term. “If that were the case, everything on the left side of the chart should have been done,” says Jules Kortenhorst, chief executive officer of the Rocky Mountain Institute, which researches sustainability.
There’s now an alternative measure of how effective a carbon-cutting measure can be. In a study published today, Columbia University’s Friedmann and his colleagues at the Center for Global Energy Policy show that “levelized cost of carbon abatement” (LCCA) could help policy makers and investors achieve the biggest carbon savings for their buck.
Its name is a mouthful, but LCCA is a simple idea. It measures the cost of an intervention—say, replacing a gas power plant with a solar farm—in relation to the tons of carbon dioxide avoided because of it. The result is measured in dollars per metric ton of carbon dioxide abated.
Consider an example. LCCA value for rooftop solar varies hugely across the U.S. If the installation helps displace a low-efficiency gas turbine in California, then LCCA is only $60 per metric ton of CO2 avoided. If it replaces a high-efficiency gas plant in New Jersey, then LCCA is $320 per metric ton instead. Following this logic, each dollar provided in federal tax credits to incentivize rooftop solar—which is currently given out uniformly across the U.S.—goes much further in cutting carbon in California than in New Jersey. In effect, if LCCA were the only metric and cutting greenhouse gases the main goal, then perhaps California should get more federal support for rooftop solar than New Jersey.
Of course, LCCA isn’t the only metric that decision makers should use. “Ultimately [it] should be one of many considerations,” write Friedmann and colleagues. For example, rooftop solar can provide more secure access to electricity, if the grid is affected by wildfires or hurricanes.
Still, LCCA provides insight into what can bring the greatest amount of carbon reduction for the same price. It gives us a framework to make a more apples-to-apples comparison of policy or portfolio options to decide which will be the most effective in cutting greenhouses gases, and thus which will have the biggest impact in addressing climate change.
Akshat Rathi writes the Net Zero newsletter, which examines the world’s race to cut emissions through the lens of business, science, and technology. You can email him with feedback.
©2020 Bloomberg L.P.